Build the AI Foundation for Retail Location Strategy: 11 Prompts to Get Started Fast

In this post, we’ll look at what is simultaneously the most boring and critical step of retail location strategy: developing a proper store database. Thankfully, AI and data in this area has dramatically improved. After reading this you will know:
- The three foundational datasets you have to get right
- Where to find the people and places data that impacts store performance
- Exact prompts for building and analyzing your data
As mundane as it sounds, the development of a store database is the most critical step in your retail location strategy. Why? Accuracy here informs every following step in the process. Let’s define what I mean by store database for a retailer:
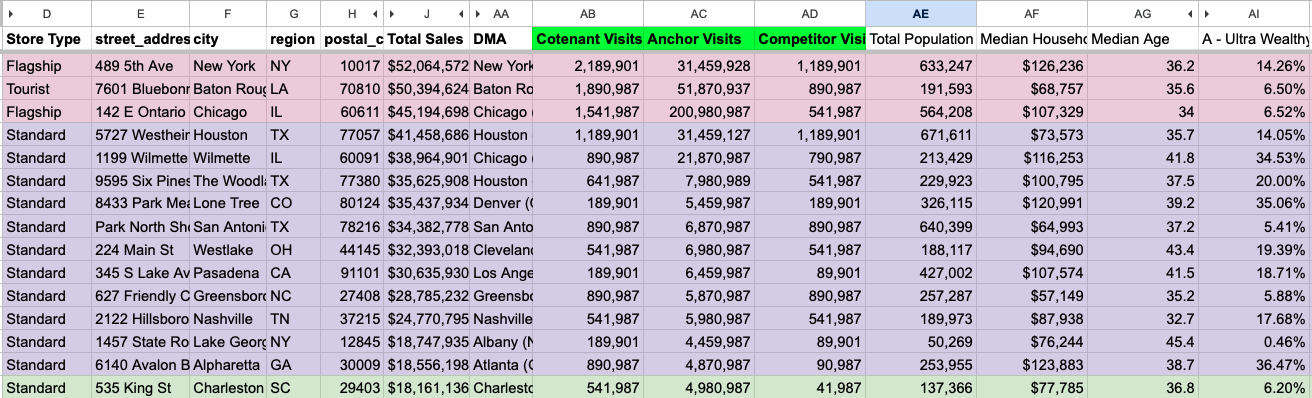
A proper store database is a centralized and accurate spreadsheet that includes every relevant measurable characteristic about the site, retail environment, and customers.
{{schedule-demo}}
The Three Foundational Datasets
There are three foundational datasets from which we can build a store database.
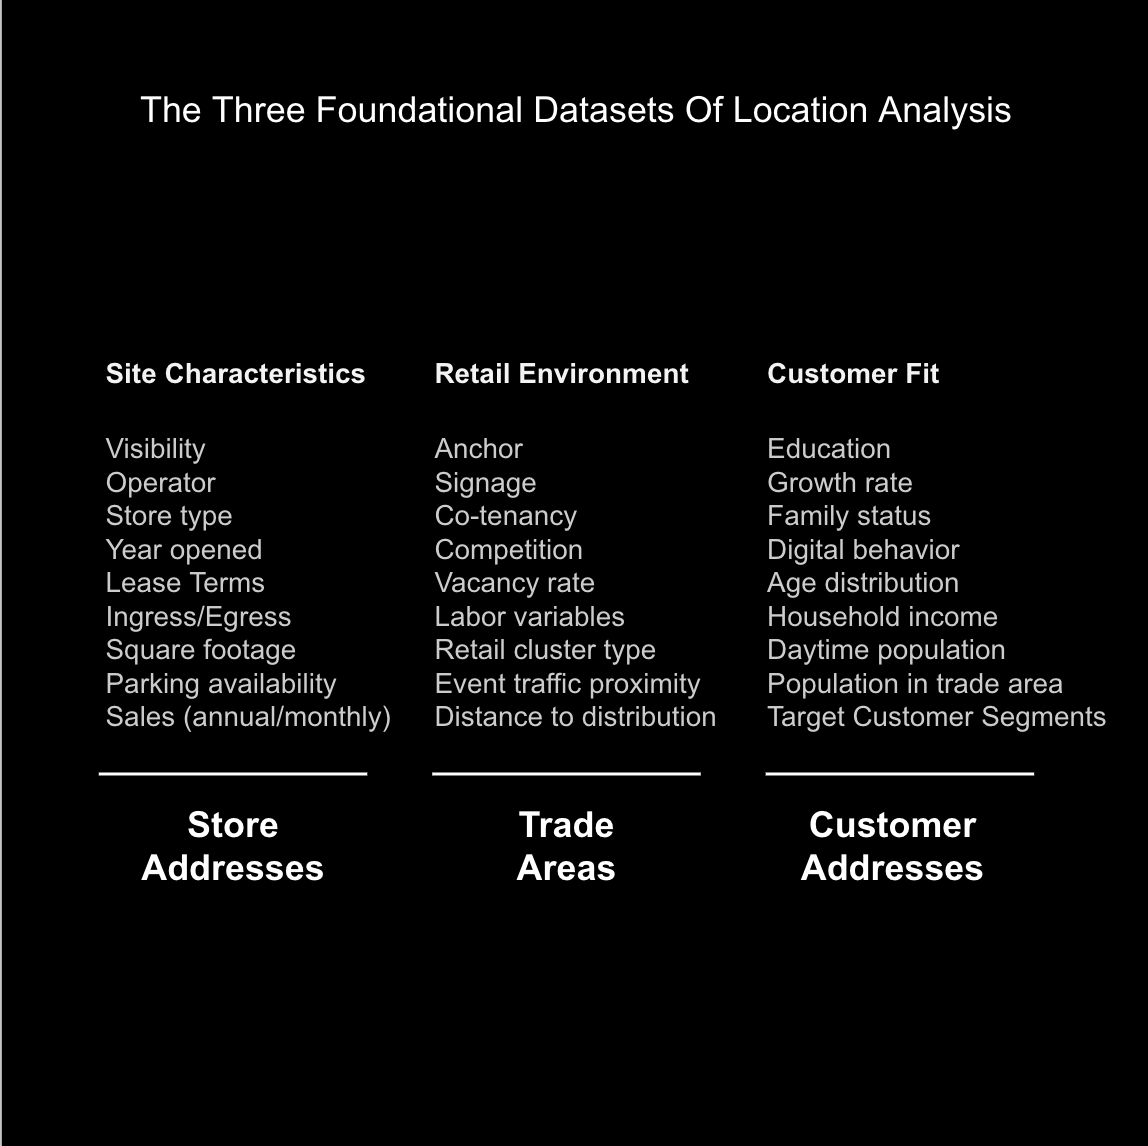
Let’s break these down in detail. I have included a checklist that, while not comprehensive to every brand, should spark ideas for the critical information you need to capture.
1. Site Characteristics
First up is site characteristics. This is information purely pertaining to your store fleet. The foundation is clean address data. To evaluate performance accurately, you need to compare apples to apples. If you’ve never done a store analysis before, you might be surprised how simple factors like parking spaces, store type, or even the operator influence results.
- Store addresses
- Sales (annual/monthly)
- Ingress / egress
- Square footage
- Parking availability
- Year opened / renovated
- Lease terms
- Store type
- Visibility
- Operator
- Hours
2. Retail Environment (Places)
Next is the retail environment. This entails external commercial factors that impact the performance of a store. The foundation is the trade area, which determines how far out to measure. It merits an entire post to itself. You’ll want to account for things like: Does your store do better anchored to a Target or Whole Foods? Which competitor most impacts sales? What type of center is it in? The more specific, the better. Knowing Lululemon is a neighbor is useful; knowing their sales is even better.
- Trade area polygon
- Anchors
- Co-tenancy
- Competition
- Competitor density (trade area)
- Retail cluster type (lifestyle, strip center, mall, urban corridor)
- Event traffic proximity (distance to sports stadiums, etc.)
- Labor variables (average wage rate, availability)
- Distance to distribution center
- Vacancy rate
- Signage
3. Customer Fit (People)
Custom fit is about the types of people in the trade areas shopping in your store. The foundation here is your customer sales data if you have it or mobile data as a proxy. By analyzing your customer and mobile data you can identify demographic or psychographic variables that characterize your best customers and go find more of them.
- Customer sales data
- Population in trade area
- Daytime population
- Household income
- Age distribution
- Family status
- Growth rate
- Education
- Digital behavior (social media, online spend)
- Target Customer Segment Index (PersonaLive, Mosaic, Tapestry)
If you feel overwhelmed and wondering where to get all this data, fear not. In the next section I’ll show you exactly where to get it.
How Data Changed The Game
The 2000s brought the digitization of data and during the 2010s smartphones hit scale. These two events brought reams of new data providers to the retail location intelligence landscape. Perhaps the most significant recently being mobile foot traffic data, which allows analysts to define trade areas without lots of customer data.
The amount of data can feel overwhelming, so I find it helpful to break the industry up into four parts with two major data types:
- Mapping & Data Visualization: These are where we can visualize and analyze our store data on a map. Major GIS players like ESRI live here, and analytics software like Alteryx.
- People Data: Information about the people in our trade areas. Their demographics, their lifestyle (geodemographics), what they spend their money on, crime, and traffic.
- Places Data: Information about places in our trade areas. Points of interest of our competitors, foot traffic estimates, listings, sales comps, tenant credit data, and parcels.
- Retail Analytics & Modeling: There are software companies that combine a mapping platform, people data, and places data into a comprehensive solution for location analysis and sales modeling.
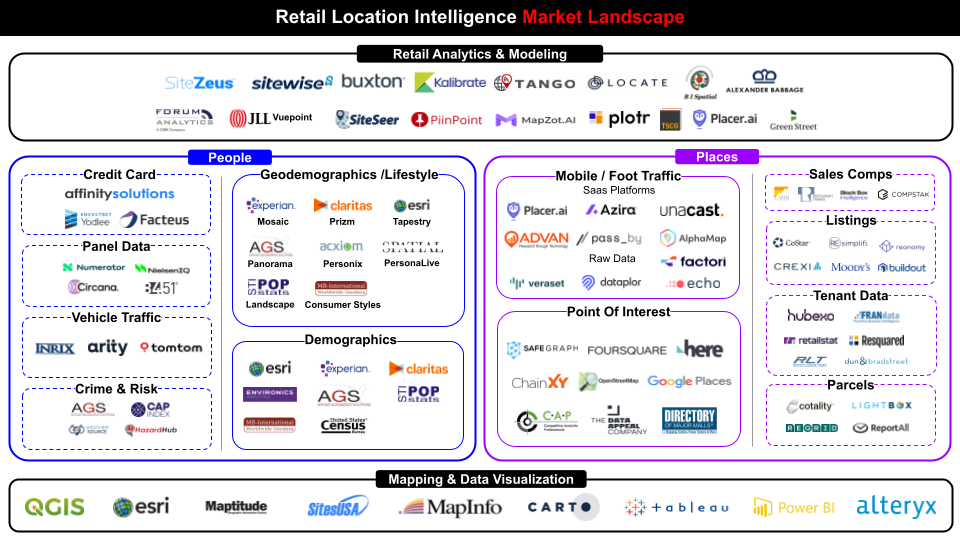
People data helps you fill out the information you need on customer fit. Places data helps you characterize and quantify the retail environment. If you are just starting out and need a cost effective shortcut, check out ESRI’s Business Analyst Online or SitesUSA.
11 AI Prompts For Store Database Development
In part 1 of this series, we discussed how AI is extremely good at three things pertinent to location analysis: Clean & Label, Simulate & Scale, Storytell & Hypothesize. Let’s break down specific examples of how AI can speed up, augment, and enhance our ability to build a stellar store database.
Automatically Collect & Clean Site Characteristics
The old way of gathering site characteristics involved analysts with boots on the ground manually entering address details, store features, and sales data, and reading through leases to find store data. The AI-enabled way automatically collects, joins, and updates this data. Here are three examples:
- Automated Feature Detection: AI vision tools can help you identify features of your store such as parking, ingress/egress points, visibility, store type, drive through etc. Imagine having an intern (or AI agent!) taking google streetview screenshots of every address in your portfolio and extracting site features.

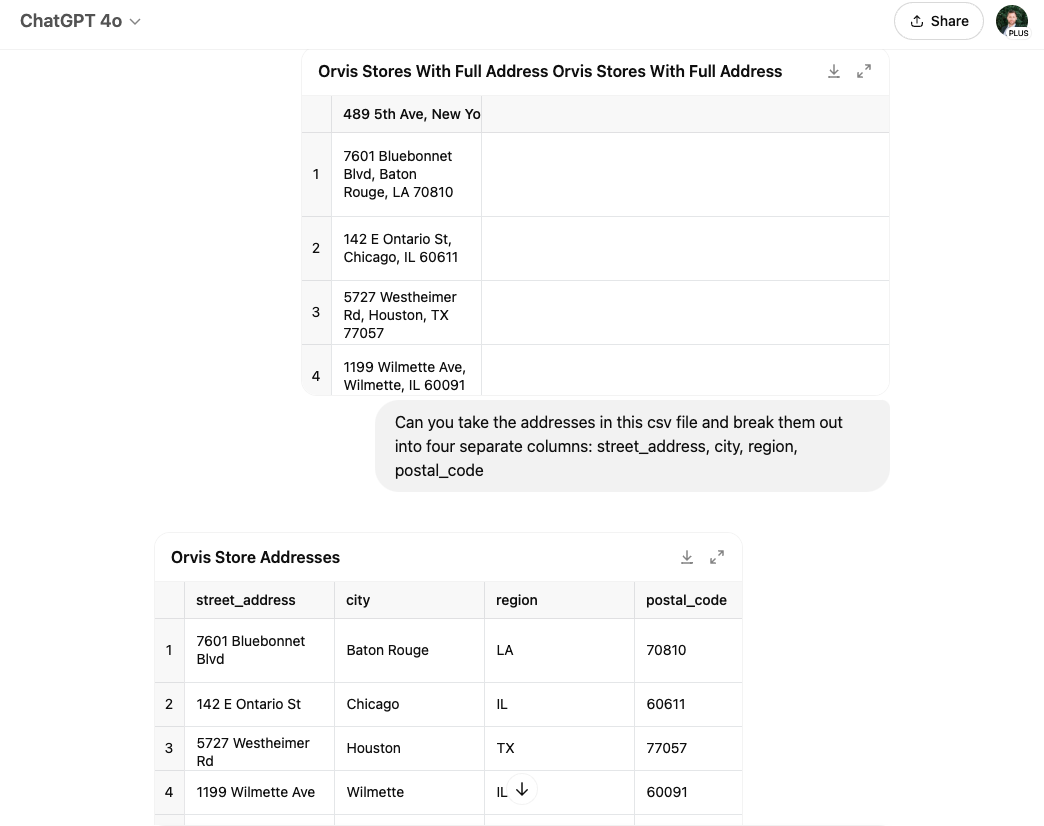
- Address & Data Normalization: When you find inconsistencies in your store-level dataset you can throw these into ChatGPT and get a consistent output that is now joinable to other datasets. Google Geocoding API, SmartyStreets, and USPS CASS can also help with this.
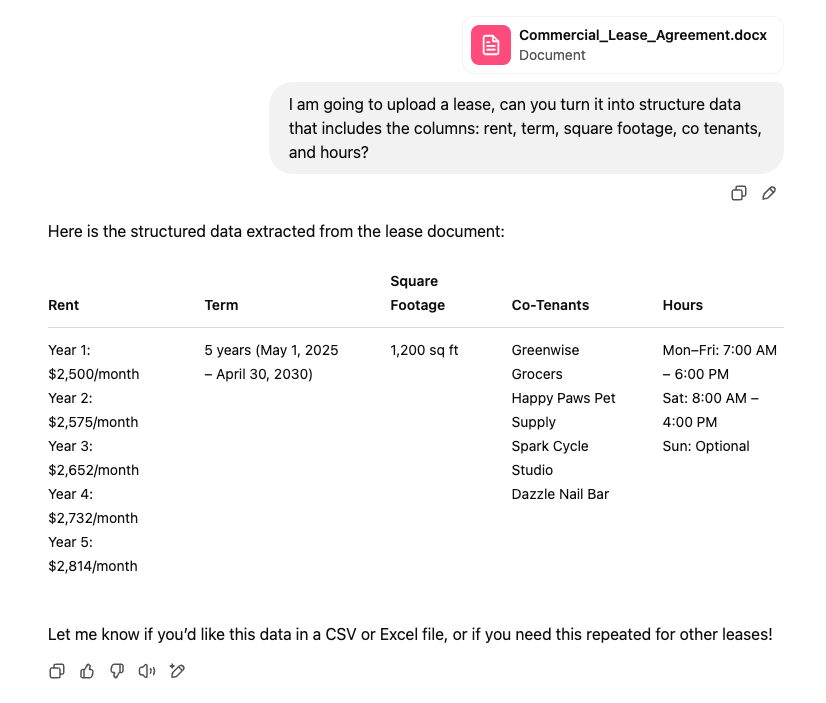
- Lease Document Parsing: LLM’s can extract structured lease data from PDFs: rent, term, square footage, co-tenants, hours etc.
These are just a few examples. How you approach this will be unique to your brand, but this first step is ripe for using AI’s Clean & Label capability.
Monitor the Retail Environment In Real-Time
The old way of evaluating the retail environment had analysts “guessing” nearby competitors, estimating co-tenancy value, and running on data that was true when you first signed the lease. The AI-enabled approach gives you objective competitor and co-tenancy value, automatically joins, summarizes, and alerts you when there are changes. Here are some practical ways of keeping a real-time database of the retail environment using objectively defined competitors, co-tenants, trade areas, etc.
- Update Databases With AI Agents: You can have daily feeds of your data uploaded, updated, and joined without lifting a finger after some simple set up. Use an AI agent or API to connect retail POS sales, daily trade area competitor and co-tenant visitation from a foot traffic provider like Placer.ai or Advan, and target segment distribution from Tapestry or PersonaLive. You can accomplish this by sending data to a spreadsheet via Zapier, use a custom GPT to read the latest values, summarize trends, and compute segment changes.
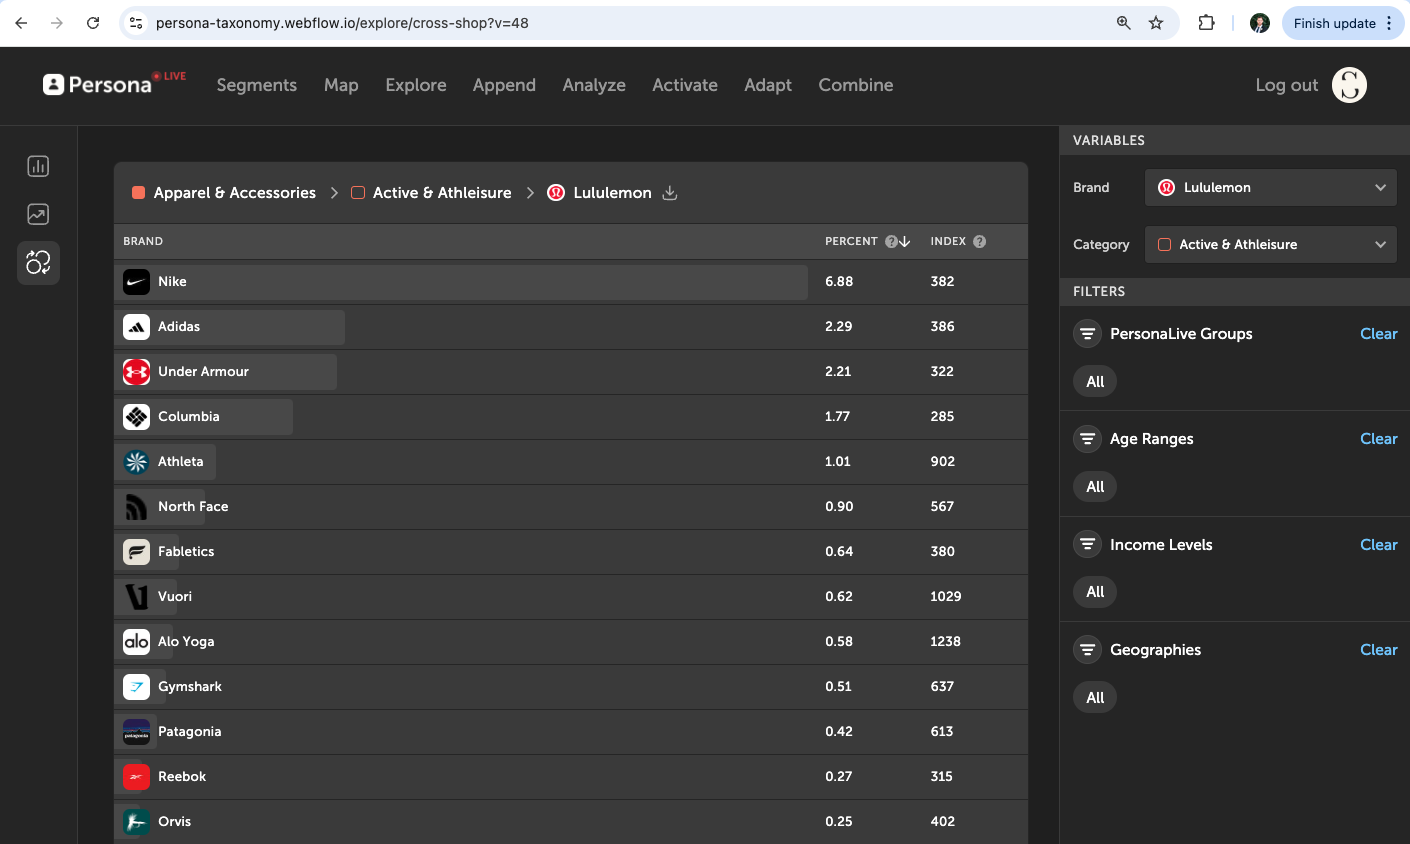
- Objectively Identify Competitors & Co-tenants: Picking the right competitors and co-tenants is the basis of understanding the retail environment, but who you consider your competitor is often a best guess. Rather than making your best guess, you can use credit card cross-shopping. For example, using PersonaLive Spend data, you can see that of all the cards who have bought from Lululemon, 6.88% have bought from Nike; Lululemon customers are 3.6x more likely to buy Nike than the national average. This analysis can be split by segment, age, income, and geography. Placer.ai also allows you to see a similar view using foot traffic data.
- Detect Store Relationships: With a constantly updated database of relevant store and trade area information you can begin to ask questions that draw important relationships. For example, do we do better anchored to a Target or Whole Foods? What happens to my store sales when competitive or co-tenant visits are up?
- Set Up Real-Time Alerts: Once you identify those key relationships, you can set an email alert that will keep you aware of all the relevant happenings in your trade area. Such as “send me a list of the locations in which I am losing market share to my competitors”, or “alert me if a competitor is slated to build in our area (using Hubexo data).
Customer Fit (People)
The old way of segmenting your best customers usually meant DIY methods of attaching customer or mobile data to block groups and relating that to census information. Or it meant working with a consulting company on an expensive multi-month process, sharing customer data that is attached to static segmentation and a powerpoint presentation.
The AI-augmented approach automatically segments your customer data, attaching psychographic and demographic traits to help you identify new locations. And then immediately shows you where those best or rising opportunities are and visualizes what they could look like.
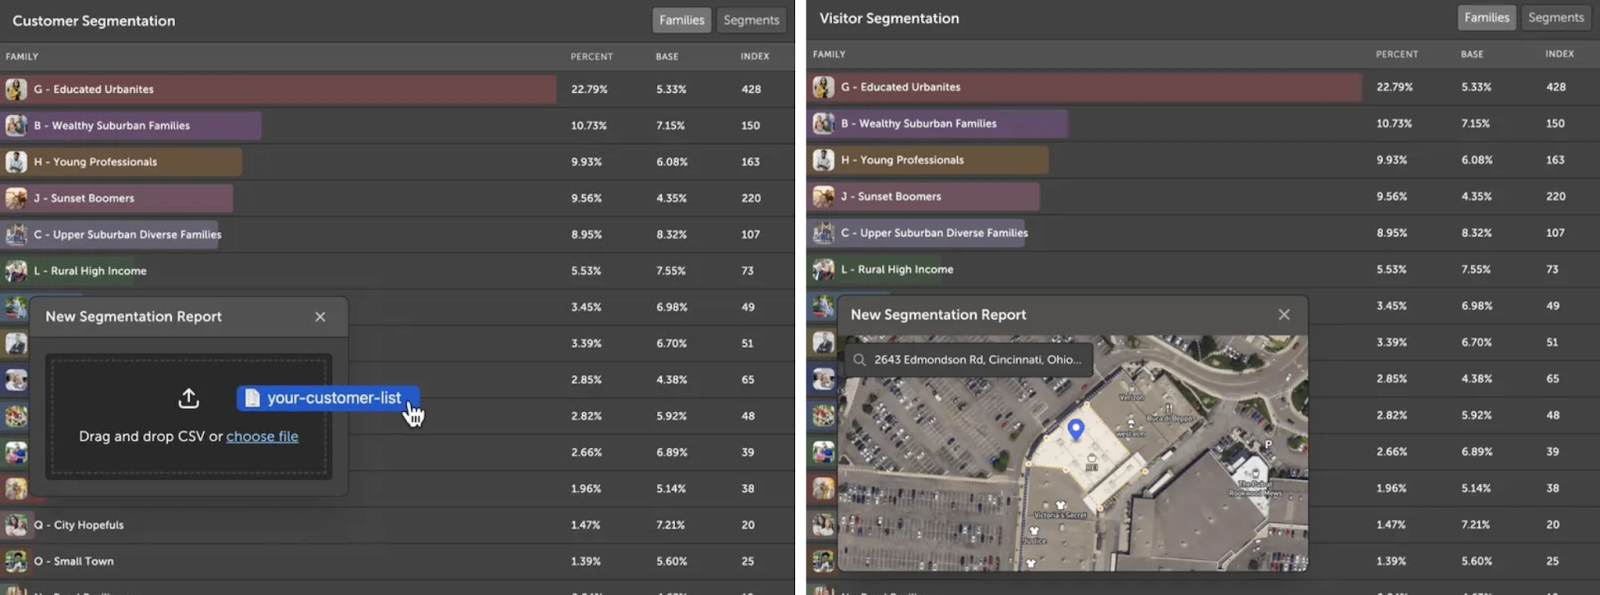
- Segment Customer Automatically: Instead of manual GIS or hiring consultants you can simply drop a CSV of customer data into a tool like PersonaLive and get back your segments by percentage and spend. Or, even easier, you can leverage the pre-populated credit card spend or mobile visitation for your competitive brands.
- Anticipate Future Growth: Based on customer fit areas and growth you can prompt the LLM to share emerging ZIP codes that are growing in population of your target segments, or emerging retail centers that are growing in visitation by your target segments. By adding these to “watch” markets you can pair this with an alert whenever there is an open lease via RE-Simplifi listings data.
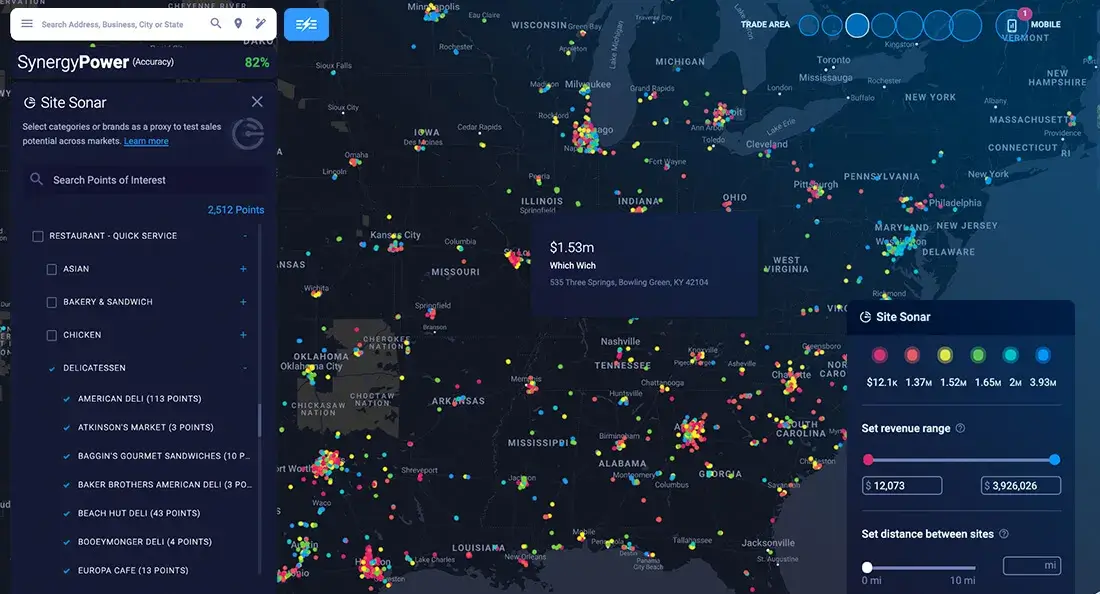
- Scale Simulation: Perhaps you find that Target is your best anchor. You can use every Target in the US as a seed point to run a simulated sales forecast. SiteZeus’s Site Sonar is a great example of this.
- Create Compelling Real Estate Committee Presentations: Once you have narrowed to a few sites, you can have the LLM write a trade area summary of your top sites and visualize what the space will look like for your brand and spit out a visualization of what the area could look like surrounded by the relevant customer set.
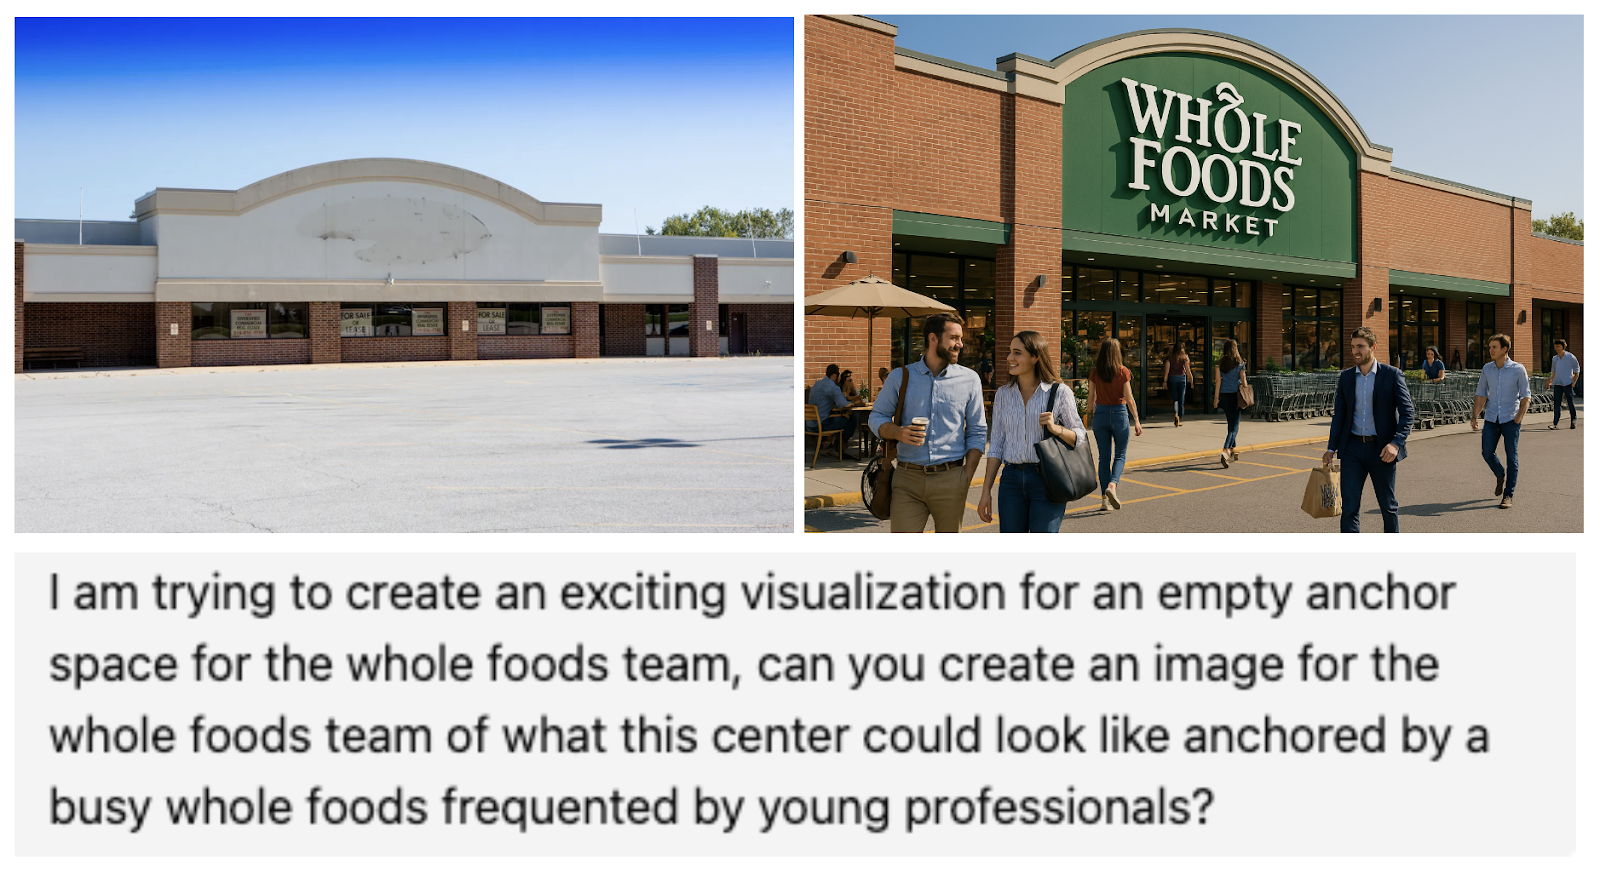
AI can transform your customer fit metrics from a static, laborious demographic snapshot to an automatic living profile. It doesn’t just tell you who customers are now, it can help you find who they could be, should be, where to find them now, and where they are merging.
Your most valuable customer segment may already be gathering somewhere. This helps you find them first.
Start Building Your AI-Enabled Store Database
Building a store database used to be a manual slog of spreadsheets, surveys, and static reports. But as you’ve seen in this article, AI is fundamentally reshaping how we source, clean, label, simulate, and scale the core data that drives smarter retail location strategy. From auto-parsing leases to simulating customer fit across every retail node in the US., the tools aren’t just theoretical—they’re here, and they’re working.
Want to see these AI workflows in action?
Join us for our free webinar: AI in Retail Location Strategy: 5 Tools for Smarter Site Selection
You’ll walk away with:
- Real-world demos of AI tools used by top retail brands
- More practical prompts to apply AI across your location strategy
- A framework for scaling your site selection process faster—and smarter
{{site-selection-webinar}}
What you should do now
Whenever you're ready, here are 3 ways Spatial.ai can help:
- See PersonaLive In Action. If you'd like to segment and target your best customers using real-time behavioral data, schedule a free 30-min demo to get started.
- Subscribe To Consumer Code. If you've found this helpful, check out our newsletter and podcast where we share more consumer research and insights for retail marketers.
- Share This Post. If you know another marketer who’d enjoy reading this post, share it with them on Linkedin, X, or Facebook.
Get retail marketing tips
We email every monday with smart growth strategy ideas. Almost no promotion. Just value.

.avif)
%20(1).jpg)


Looking to integrate AI into your location strategy? Join us for our free masterclass—AI in Retail Location Strategy: 5 Tools for Smarter Site Selection—on April 16. Register here.

%20(1).jpg)