FAQ
General
What are the differences between datasets?
PersonaLive segments individuals using social media, interests, mobile movement data, and demographics. The base unit of PersonaLive is a person, whereas Proximity is a block-group dataset because it summarizes geolocated social media activity within areas. Click here for more.
PersonaLive
How is this different from MOSAIC, PRIZM, etc.?
While other geodemographic segmentation systems use only demographics to cluster individuals, PersonaLive uses social media, demographics, mobile movement data, and interests. Click here for more.
What sources are used to segment people with PersonaLive?
Individuals are bucketed into one of eighty segments using a combination of three factors:
- Social Media: Who they follow and what they say
- Mobile Visitation: Which brands they visit
- Individual demographics: Income, age, marital status, etc.
You can read more about sources here.
What is the base size?
The base size of the data used to categorize or describe a segment includes approximately 52 million public social media profiles, 117 million mobile devices, 200 million desktop devices, 281 million individual demographic records.
Can someone belong in more than one segment?
Each individual belongs in only one segment. After significant life changes (if an individual moves, has a child, gets married, etc.) an individuals segment may change.
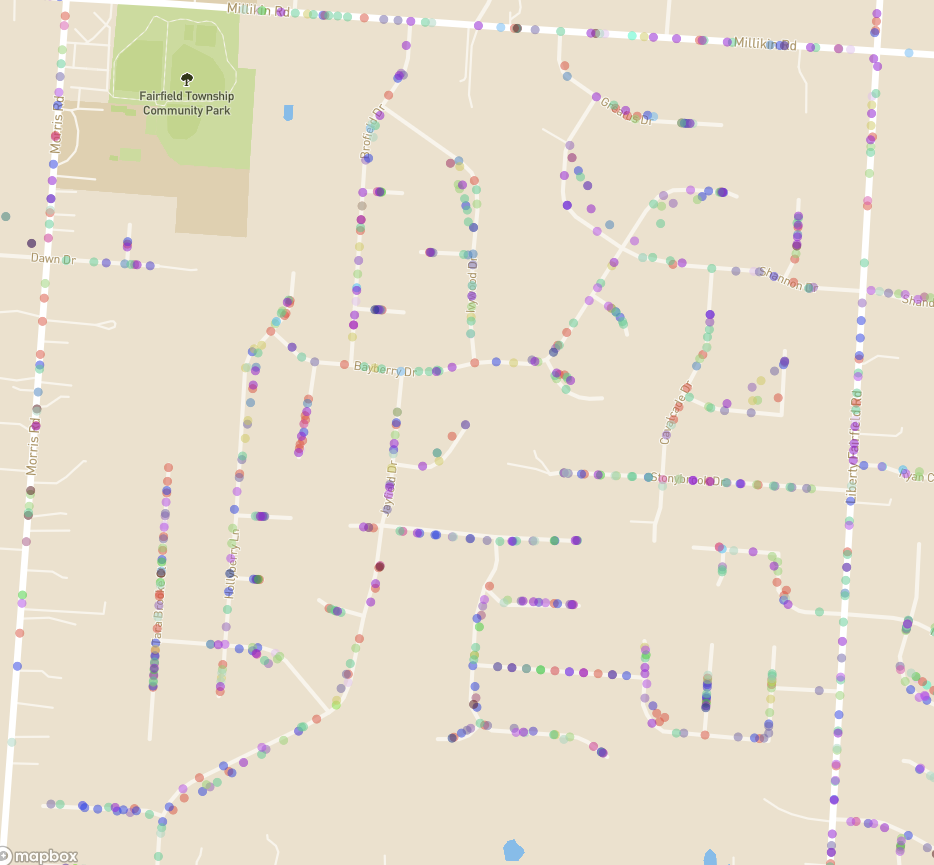
Is everyone in a census block grouped into the same segment?
Because PersonaLive is built at the household level there are multiple segments in every block group. For example, the picture below represents one census block group. The dots are households, the colors are different segments.
What is the difference between families and segments?
Families are simply groups that segments roll up into. The taxonomy is designed with 17 upper level families. Those 17 families contain 80 total segments. The utility of families comes into play when you want a higher level analysis, or when you do not want to split creative up to personalize to numerous segments the 17 families can simplify personalization down to just a few segments. Here is an example of family & segment grouping.
J - Sunset Boomers (Family)
J01 - #PicturesqueProsperity
J02 - #DestinationRetirees
J03 - #CouplesCoastingIn
J04 - #GoldenCitySolos
J05 - #ScenicSeniors
All five of these J segments roll up into Sunset Boomers. The segments within a family are always ordered by the highest income to the lowest within the family.
What Do Indexes Represent?
An index measures a segment’s propensity to do something compared to the national average. All of the indexes in PersonaLive are centered around 100 - which in this case is the national average. A score of 200 is twice as likely, 300 is three times as likely. Here are some practical examples:
M03 - #Camo&Cornfields has an index of 366 for visiting Tractor Supply Co. This means they are 3.66x more likely than the average American to walk into a Tractor Supply Co.
G03 - #Urbanists have an index of 421 for following Warby Parker. This means they are 4.21x as likely to follow Warby Parker on Twitter and Instagram.
Why do you use indexes and not percentages?
Indexes make all scores comparable. This allows you to compare a big box store like Walmart with a smaller retailer like Warby Parker.
You can read more about indexes here.
How are Head of Household Age & Estimated Income determined?
Because PersonaLive primarily categorizes people on behavior, segments will not conform perfectly to any one income, age or race bucket. We use a combination of the highest indexing and highest percentage age and income range buckets according to the US census to provide the typical head of household age and income for each segment.
What is the date range of the live social topics?
Live social topics represent the top unique social topics for a given segment in the past two weeks. You can learn more about live social topics here.
What is the date range of the live in store visitation?
Live in-store visitation is updated weekly and represents change in visitation in the most recent month compared to 12-month average. You can learn more here.
Where does the channel preferences data come from?
Channel preferences measure a segment’s overall propensity to multiple accounts within that category. This data is generated using social media following data. These are designed to direct media budget allocation, direct ad placements, and by looking at the individual accounts followed you can get a good sense of the types of people who are in a segment. You can learn more here.
How can the channels metadata inform media spend?
Using the channel Preferences radar map you can see where each segment is most engaged across magazines, websites, news publications, podcasts, TV channels, and TV shows. Here is a practical example:
When targeting H02 #RisingProfessionals for example, you may want to focus on podcasts: with an index of 130 they are 30% more likely to engage with podcasts. Whereas with an index of 86 for TV channels they are overall less likely to pay attention to TV.
When targeting N01 #DirtRoadDynasty you want to focus on TV placement: with an index of 170 they are 70% more likely to engage with TV channels on social. Whereas with an index of 88 for podcasts they are overall less likely to pay attention to TV.
You can learn more here.
How can the channels metadata inform ad placement?
By looking at the exact publications underneath each channel we can more intelligently choose which websites we want our ads to show up on. For example, when targeting A01 #MidasMight we might want to tell google to only place ads for that audience on:
- foreignpolicy.com
- wsj.com/noted
- venturebeat.com
This reduces wasted ad spend and has the added benefit of controlling the context in which that type of person sees your ad.
You can learn more here.
How can social media topics to inform creative?
The Social Media Topics panel shows the top unique hashtags for that segment over the past year. We learn from segment A01 #MidasMight that they talk about things like #balance, #homesweethome, #socialmedia, #google, #cnn, and #millennials.
Taking into context their income level and age along with their top hashtags we can begin to build the picture that these are plugged in, well off professionals. We may want to include the #hashtags these people use as inside jokes in communications or allow the topics to inform the imagery - in this case, we may include more techy imagery with their interest in tech or include yoga mats as they tend to live in proximity to areas where yoga is prevalent.
How can we use social media topics to anticipate interests?
By clicking the month you are moving into on social media you can begin to plan your campaigns around the topics that are interesting to your customers. A01 #MidasMight for example was talking about #climateaction, #earthday, #earthdayeveryday, #planetearth, and #gardening last April, we can get out ahead of their interests by planning our content calendar around what is important to them.
How can the Influencers metadata be used for influencer marketing?
The idea here is to find niche influencers that have an outsized following among your key segments. Perhaps you are a skincare brand and wanting to target E02 #UrbanFashion. You find that females in the #UrbanFashion segment are 5.63x as likely to follow Regina King on social media. This could either lead you to consider an influencer marketing campaign or to repromote her content to test response.
Which brands are included when calculating visitation indexes?
While there are a very small number of exceptions, all brands that have visitation indexes calculated must:
- have at 50 locations
- have locations in at least 10 states
- have locations in at least 3 regions (regions defined by the Bureau of Economic Analysis)
How is regionality accounted for when calculating visitation indexes?
Indexes are calculated using data only from markets where each brand is present. So, for example, if Brand A has locations only in San Franciso, LA, Vegas,... then we would only calculate indexes using segment and location data from those markets. If a given segment doesn't have enough exposure to a given brand, then no index will be calculated for that particular brand-segment pairing.
How can a retailer or property owner use the Interests metadata?
By understanding the shopping and lifestyle themes in the Interests section—variables built from groups of related social accounts rather than single handles. If for example you find that 90% of the population surrounding your retail location consists of E02 #UrbanFashion, you might look at their Interests panel and find they are 2.58x more likely to index on wigs, 58% more likely on jewelry and leather goods, and 35% more likely on fragrances. Those patterns can inform which co-tenants or product mixes fit the trade area.
How can a creative team use the Interests metadata?
By grounding creative in the same themes. For example, if you are targeting J02 #DestinationRetirees, you might notice strong travel and recreation Interests—this group is 3.21x as likely to index on Palm Beach–style vacation themes. In creative you might picture retired travelers relaxed near a beach.
Why are there people with different demographics in the same segment?
Because PersonaLive is primarily a behavioral segmentation (mobile movement data and social media data) it groups people more on how they behave than their demographics. So you may have average income people with higher income behavioral patterns. Or you may have higher income people that behave very frugally and are placed in a primarily average income segment even though they make $200k + per year.
Can I use PersonaLive to compare my own business vs. competitors?
Using our comparison tool, you can compare segments across any two variables on an X & Y axis. We could for example compare social media following between McDonalds and Wendy’s by segment. This gives a sense of who each brand is winning with and who they are competing for. You can do the same thing with who visits Chick-Fil-A vs. Raising Cane's Chicken. Watch a video of this here.
Can I use the insight and comparison tools with my own customer data?
By uploading your customer data and sales into the “File Upload” tool you can begin comparing segments by their behavior related to your brand. You can see an example of a custom metric for a brand here.
Where can I get foot traffic/mobile data?
You can upload foot traffic data from any mobile data company such as Near, Placer.ai, Safegraph, etc.
When uploading customer data, what information is required to match a customer to a segment?
At a minimum, we need an address for the customer. Adding additional information like first name, last name, etc. can improve the match rate. Follow instructions in the upload tool for more specifics and examples.
Proximity Dataset
What are the data sources?
The vast majority of the data are geotagged twitter and instagram posts.
What is the time window?
The data is based on a running 24 month time window. This timeframe accounts for seasonality and tends to be the most predictive of retail sales.
How is this different from MOSAIC, PRIZM, etc.?
Geodemographics such as MOSAIC and PRIZM are a classification of areas based on demographics of the people who live in that area. By applying survey data such as GFK MRI analysts get a sense of what behaviors to expect from an area based on the area’s demographics.
Our Proximity dataset scores areas for various attributes based on what people are doing and saying on social media in that area.
In this case two areas can be similar demographically yet have different social behaviors that can impact sales and as a result lift a predictive model.
Is social media mainly used by youth?
15% of social media users are over the age of 55*. There are specific segments that correlation with age: such as “student life” where the age is 23% below that national mean, or “farm culture” where the age is 9.79% older than the national mean.
*https://www.pewresearch.org/internet/fact-sheet/social-media/
How is volume accounted for?
We provide a volume index that is directly proportional to the amount of posts in an area. This can be used in a weighted average for a trade area.
Do the posts come from where the behavior was tagged or the home block group of the user?
Posts come from where the behavior was geotagged. For this reason a tighter trade area is recommended to reveal what is happening near a store or in a area.