![]()
Overview
Geosocial Proximity is the result of processing millions of social media posts, all with an associated geospatial coordinate (latitude, longitude), and converting them to scores that describe what an area is like. It answers the question: What is this area like based on the social media coming out of it? All areas are given a score from 0-100 for 72 unique segments that are based on common social media patterns.
Why use Geosocial Proximity?
When it comes describing an area, using only demographics doesn't tell the whole story. By including data based on the social media coming out of an area, you can get a better picture of what an area is like, both in actual, human understanding and through improved performance of predictive models.
Let's use the example of Central Park in NYC to illustrate. Here's a heat map of Manhattan surrounding Central Park.
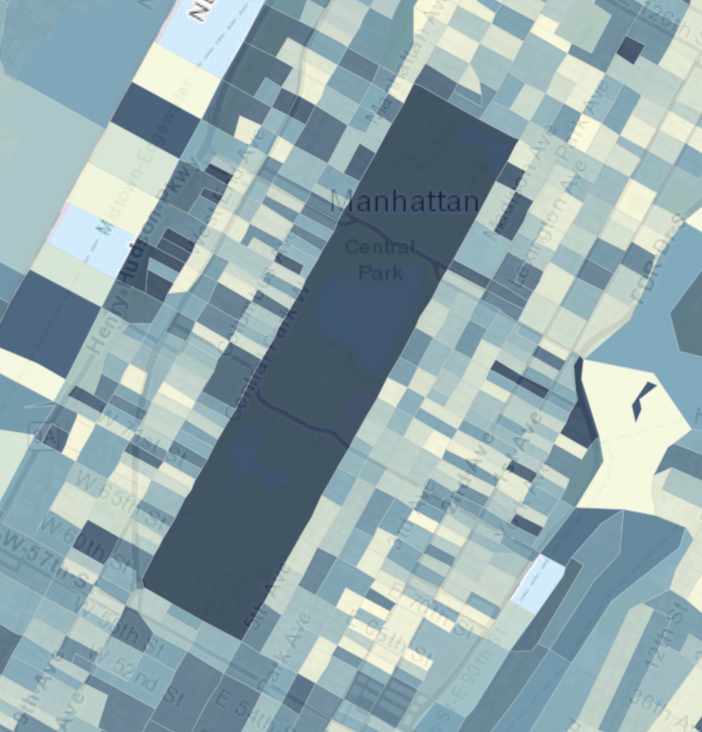
A demographic dataset would only tell you that this area has a population of 0, and no other helpful information. On the other hand, our Proximity dataset is full of rich data describing the area based on the social media coming out of it. In this heat map, the darker the area, the higher it scores for "Natural Beauty", which is one of the segments of our Proximity dataset. Further, this area has 605X(!) the median amount of social media coming out of it (as compared to a typical block group). A model using only demographics wouldn't know that Central Park is Central Park. It would just see an unpopulated area.
When trying to understand an area for location decisions, understanding what the social media says about that area can help humans and predictive models alike.
What's different about this dataset?
There are a couple of main things that make this dataset different from typical offerings.
- It is based 100% on social media.
- It captures data about what is happening in a given area. It is NOT based on home location, like the vast majority of datasets out there.
Because this data is based on social media alone, that makes it good at complementing other datasets. We regularly find that including our Proximity dataset in predictive models provides lift over only using psychographic or demographic datasets.
Sample Data
You can find sample data for this data at this link.
One Pager
You can find a shareable one-pager summarizing Proximity at this link.
Coverage
Data is readily available anywhere in the USA, Canada, UK, and Mexico. These scores can also be generated anywhere people post on social media. Today, that means almost anywhere on the planet. Coverage for other countries may be made available through special request. The standard geographic level at which scores are provided in the USA is census block group (BG). In Canada, it is dissemination area (DA). In the UK it is Lower Layer Super Output Area (LSOA). In Mexico, it is Área Geoestadistica Básica(AGEB).
Changelog
You can view our public changelog for the Proximity dataset at this at this link.