Delivery Format
Now that we've explained the dataset structure, we can go over the file format in which this data is delivered. Depending on your use case, the segmentation data is typically provided in one of two ways:
- Aggregated at geographic level
- Appended to customer records
Each approach has different use cases and advantages, but ultimately are based on the same dataset. The formats are also priced differently. Let's go over the standard file format for each.
Data Aggregated at a Geographic Level
This type of file simply includes counts and percentages of each segment (and family) at a geographic level. Standard geographic levels are block group, zip code, and county. Our data aggregated at the block group level would look like the following:
| BLOCKGROUP | A01 - #MidasMight | A02 - #SkyHigh | A03 - #ExclusiveExburbs | A04 - #FamilyOutposts | ... | O - Small Town Low Income Perc | P - Lower Hispanic Families Perc | Q - Urban Low Income Perc | Census Population | Individual Household Records | Census Household Count | Dominant Segment | Dominant Family |
|---|---|---|---|---|---|---|---|---|---|---|---|---|---|
| 515102012021 | 82 | 5 | 0 | 81 | ... | 0.0 | 0.0 | 0.0 | 705 | 281 | 306 | A01 - #MidasMight | A - Ultra Wealthy Families |
| 171670036021 | 0 | 0 | 0 | 0 | ... | 3.51 | 0.0 | 0.0 | 1530 | 626 | 626 | B03 - #BackyardBliss | B - Wealthy Suburban Families |
| 360594097004 | 0 | 0 | 0 | 4 | ... | 0.0 | 0.0 | 0.0 | 1435 | 555 | 641 | J04 - #GoldenCitySolos | J - Sunset Boomers |
| 120090641261 | 0 | 0 | 0 | 35 | ... | 0.0 | 0.0 | 0.0 | 1805 | 556 | 556 | B03 - #BackyardBliss | B - Wealthy Suburban Families |
| 550679606001 | 0 | 0 | 0 | 0 | ... | 66.17 | 0.0 | 3.17 | 916 | 388 | 473 | O01 - #SmallTownSatellites | O - Small Town Low Income |
In this example, we took a random sample of 5 block groups to demonstrate. We aren't including every column in the table, but schema below previews the full file structure. The table has 4 main sections of columns:
- Counts of households in each segment
- Counts of households in each segment family
- Percentages of households in each segment
- Percentages of households in each segment family
See the schema below.
| Column Name | Description | Type | Example |
|---|---|---|---|
| Blockgroup ID | Geographic Identifier | Str | 551332037032 |
| A01 - #MidasMight | Count of individuals within this geography in segment A01. | Int | 223 |
| A02 - #SkyHigh | Count of individuals within this geography in segment A02. | Int | 223 |
| ... | ... | ... | ... |
| Q08 - #Impoverished Parents | Count of individuals within this geography in segment Q08. | Int | 223 |
| A - Ultra Wealthy Families | Count of individuals within this geography in segment family A. | Int | 478 |
| B - Wealthy Suburban Families | Count of individuals within this geography in segment family B. | Int | 478 |
| ... | ... | ... | ... |
| Q - Urban Low Income | Count of individuals within this geography in segment family Q. | Int | 478 |
| A01 - #MidasMight Percent | Percentage of individuals within this geography in segment A01. | Float | 21.12 |
| A02 - #SkyHigh Percent | Percentage of individuals within this geography in segment A02. | Float | 21.12 |
| ... | ... | ... | ... |
| Q08 - #Impoverished Parents Percent | Percentage of individuals within this geography in segment Q08. | Float | 21.12 |
| A - Ultra Wealthy Families Percent | Percentage of individuals within this geography in segment family A. | Float | 57.88 |
| B - Wealthy Suburban Families Percent | Percentage of individuals within this geography in segment family B. | Float | 57.88 |
| ... | ... | ... | ... |
| Q - Urban Low Income Percent | Percentage of individuals within this geography in segment family Q. | Float | 57.88 |
| Census Population | Count of individuals living in this geography according to the US Census. | Int | 567 |
| Individual Household Records | Number of households in this geography for which household-specific variables are available. This column's maximum value is the same as the Census Household Count value. | Int | 328 |
| Census Household Count | Number of households in this geography according to the US Census. | Int | 343 |
| Dominant Segment | Most common segment in this geography (segment with highest household count). | String | A01 - #MidasMight |
| Dominant Family | Most common segment family in this geography (family with highest household count). | String | A - Ultra Wealthy Families |
This format is suited for applications in mapping, modeling store performance, and more.
Data Appended to Customer Records
By appending data to customer records, you can discover the patterns of higher spending individuals, find the best channels for marketing, personalize advertising to the customer, and more.
For smaller datasets, your customer records can be directly uploaded via the taxonomy website (for larger datasets or if directed, upload your records to your cloud account). Go to the base page (which shows all of the segments) and select "Upload File" in the top right corner. You will be directed to an upload screen detailing how to upload customer records to our secure cloud storage.
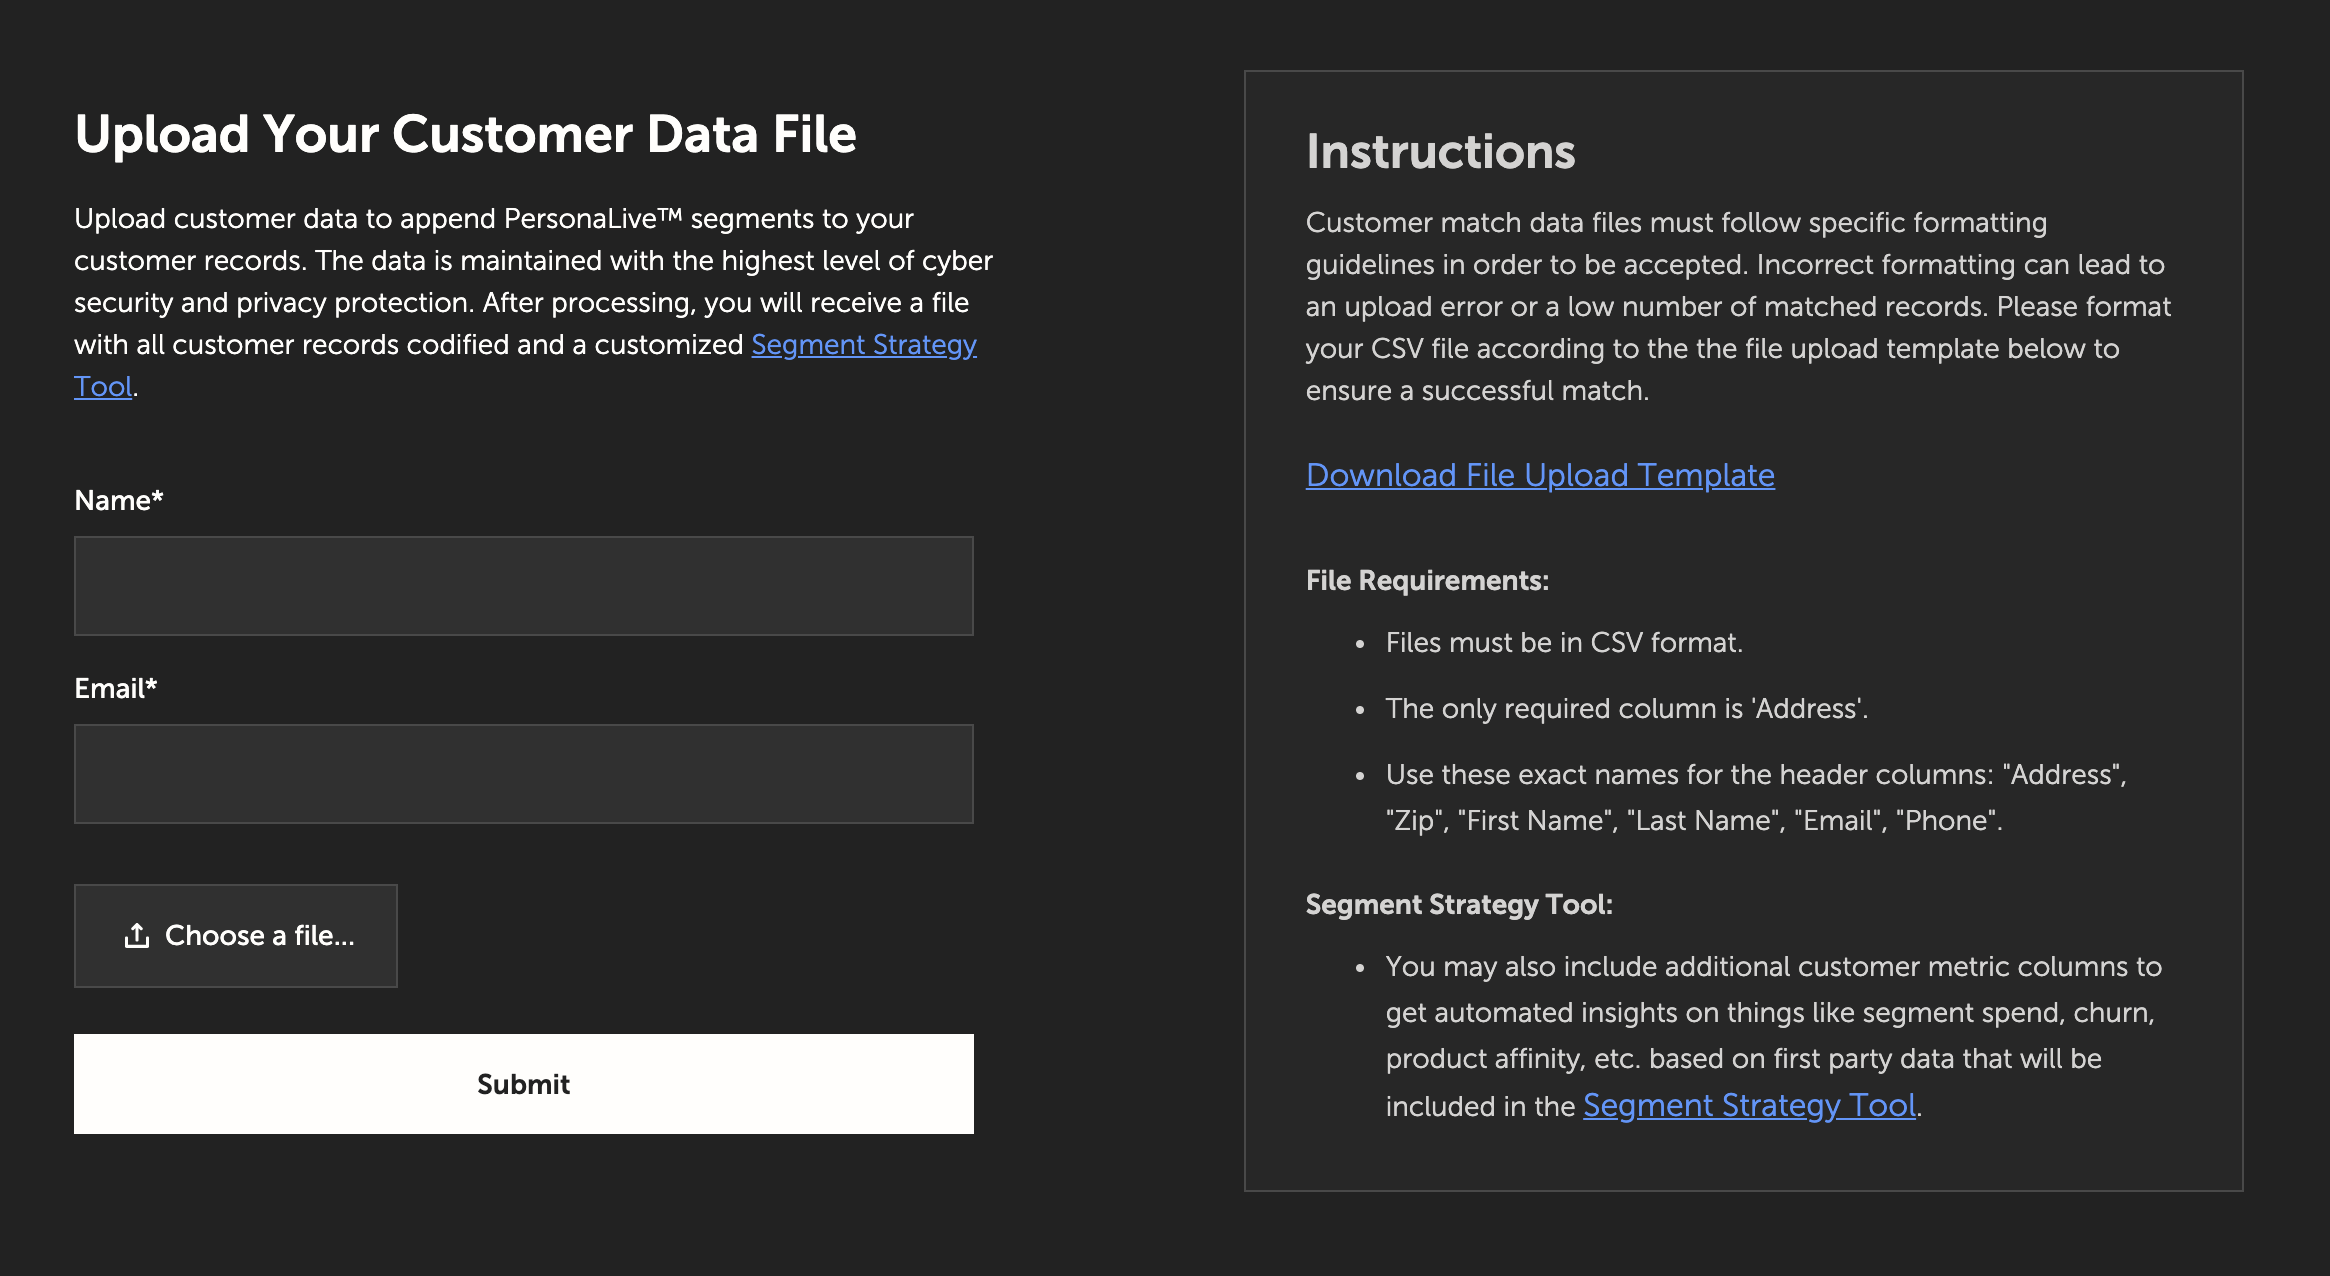
Guidelines for proper upload of a customer record CSV are included on the upload page. For matching purposes on our side, we have the name, address, and sometimes email and phone number of customers. The more information that you are able to provide, the more likely it is that a match will occur. In cases where customers are not matched, we will make our best guess based on the information available. For example, if we have an address but are not able to match to the household, we will most likely use data from the block group to match (and in rarer cases zip code). Given an email or phone number, it may be possible to match without address information.
For larger datasets, we will work with you directly to establish the data transfer process that works for you.
When you upload customer records that include metrics such as spend, the output will also include our segment strategy tool, which is described below.
Example Upload File
The following table shows an example of 3 customer records.
| ID | Address | Zip | BLOCKGROUP | Latitude | Longitude | First Name | Last Name | Phone | Spend | LTV | Churn Y/N | Metric 1 | Metric 2 | |
|---|---|---|---|---|---|---|---|---|---|---|---|---|---|---|
| 1 | 1008 Race Stree, Cincinnati, OH, 45202 | 45202 | 171670036021 | 39.1063 | -84.5159 | John | Smith | john@gmail.com | (123) 456-7899 | 111.89 | 678 | N | 89.13 | 5 |
| 2 | 990 W Bluegrass Ave, Fort Thomas, KY, 41075 | 41075 | 515102012021 | 39.0822 | -84.4484 | Zoe | Smith | zoe@gmail.com | (123) 456-7899 | 98.13 | 223 | Y | 73.1 | 2 |
| 3 | 660 Main Street, Cincinnati, OH, 45202 | 45202 | 120090641261 | 39.1042 | -84.5101 | Morgan | Freeman | morgan@gmail.com | (123) 456-7899 | 151.43 | 1039 | N | 12.5 | 18 |
While including more fields is better, the only required field is address. Including specific fields for block group, Latitude and Longitude, and/or zip can help speed up the process significantly, however. Further, including metrics such as spend, churn, LTV, and more allows us to summarize which segments are you best customers. See the segment strategy tool below for more on summarizing customer metrics.
Example Appended Record file
The following screenshot shows an example output. Scroll right to see that we've appended segment classifications to each record as well as indicated the match level of the results. For records that we can't match a specific address and/or name, we will fill in with the dominant segment in the area they live in (usually at block group or zip code level).
| ID | Address | Zip | BLOCKGROUP | Latitude | Longitude | First Name | Last Name | Phone | Spend | LTV | Churn Y/N | Metric 1 | Metric 2 | Segment Name | Segment Family | Match Level | |
|---|---|---|---|---|---|---|---|---|---|---|---|---|---|---|---|---|---|
| 1 | 1008 Race Stree, Cincinnati, OH, 45202 | 45202 | 171670036021 | 39.1063 | -84.5159 | John | Smith | john@gmail.com | (123) 456-7899 | 111.89 | 678 | N | 89.13 | 5 | G03 - #Urbanists | G - Educated Urbanites | NAME |
| 2 | 990 W Bluegrass Ave, Fort Thomas, KY, 41075 | 41075 | 515102012021 | 39.0822 | -84.4484 | Zoe | Smith | zoe@gmail.com | (123) 456-7899 | 98.13 | 223 | Y | 73.1 | 2 | B03 - #BackyardBliss | B - Wealthy Suburbanites | ADDRESS |
| 3 | 660 Main Street, Cincinnati, OH, 45202 | 45202 | 120090641261 | 39.1042 | -84.5101 | Morgan | Freeman | morgan@gmail.com | (123) 456-7899 | 151.43 | 1039 | N | 12.5 | 18 | G03 - #Urbanists | G - Educated Urbanites | ADDRESS |
You can use the result file for your own analysis and to identify customers belonging in each segment. Metrics you upload may be summarized in the segment strategy tool/dashboard.
Segment Strategy Tool
When you upload performance metrics such as sales, churn, etc., we are able to auto-generate some lightweight summaries of the given metrics broken down by segment and family.
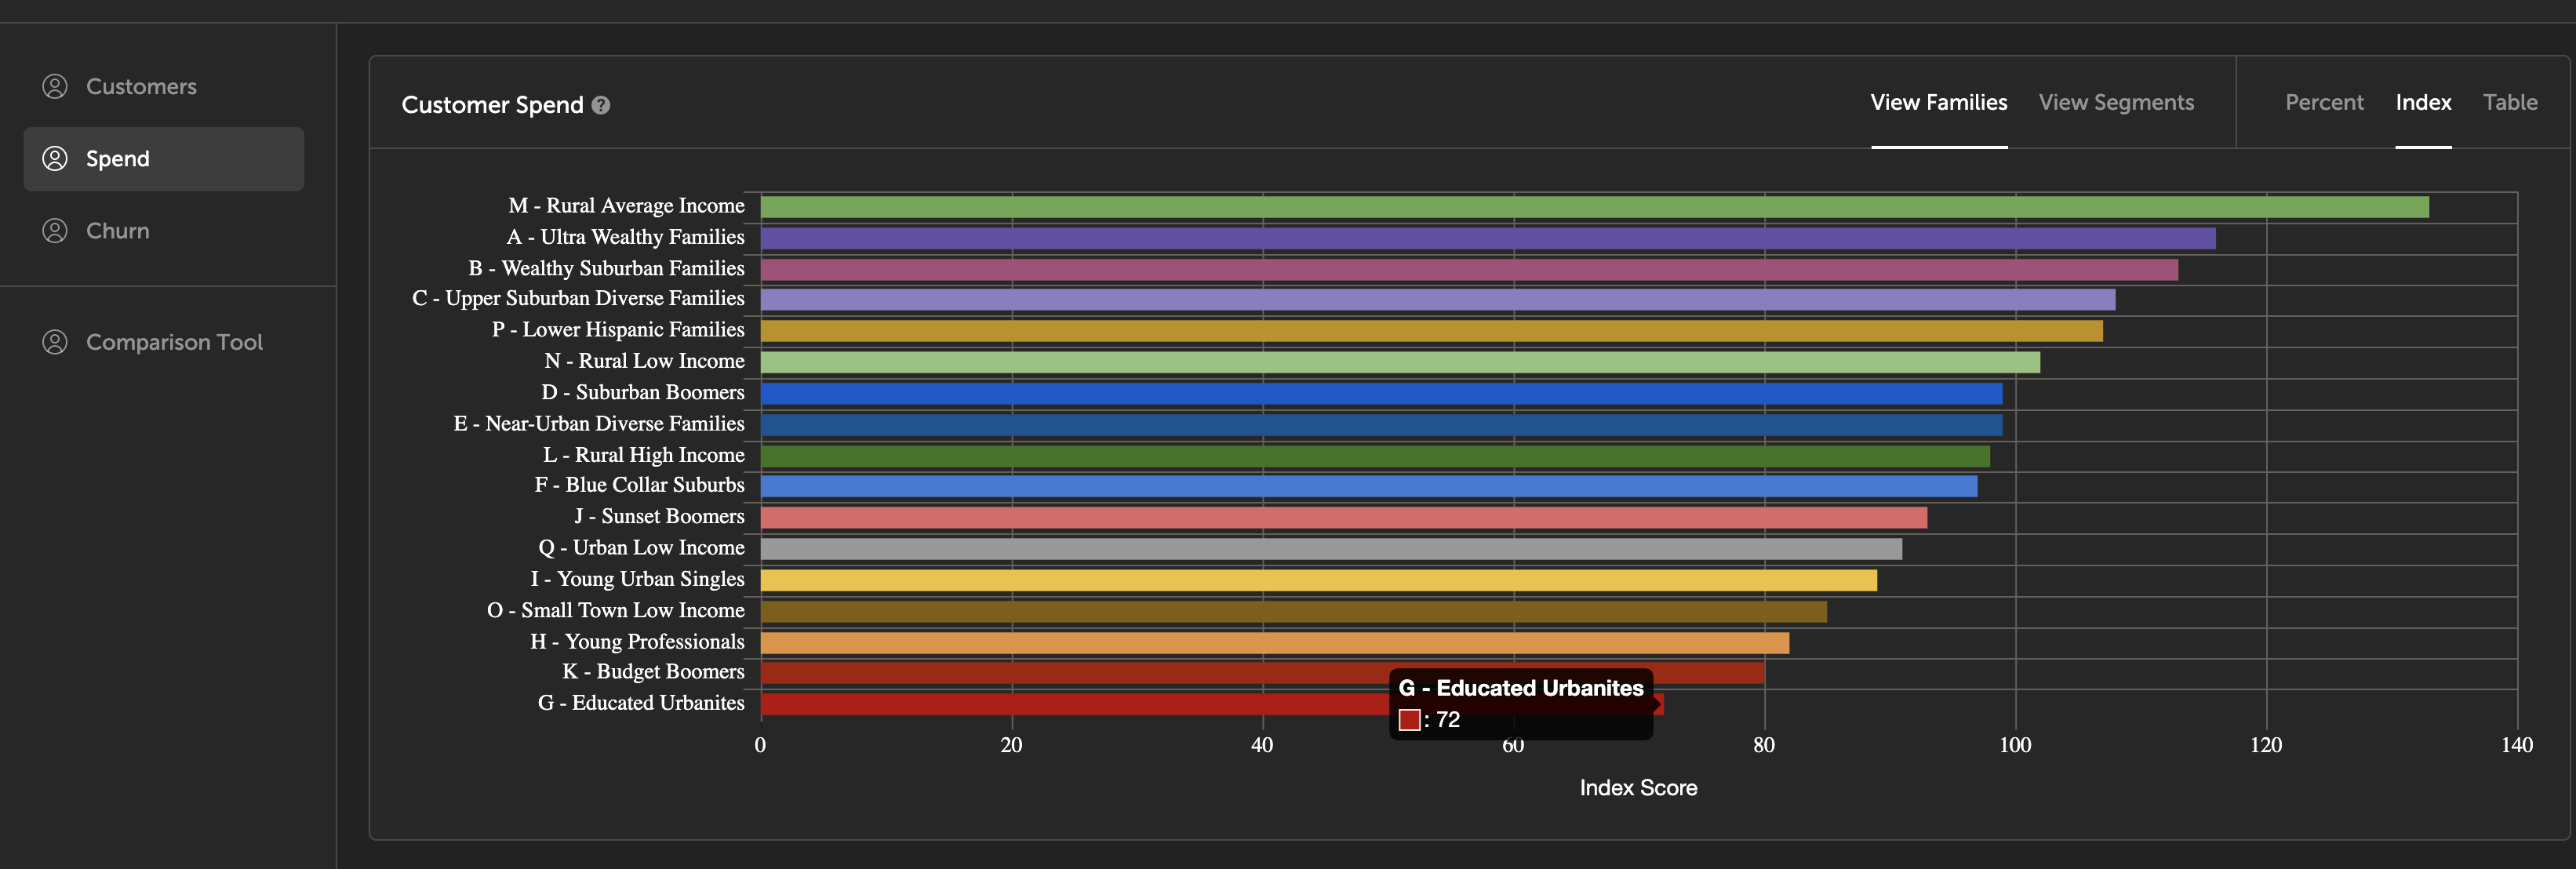
In the above screenshot, we are showing a table of spend broken down by segment family. On average, M - Rural Average Income is the family of segments spending the most. In this case, the displayed values are indexes (Educated Urbanites, which scores a 72, only spends .72x the average person, or 28% less).
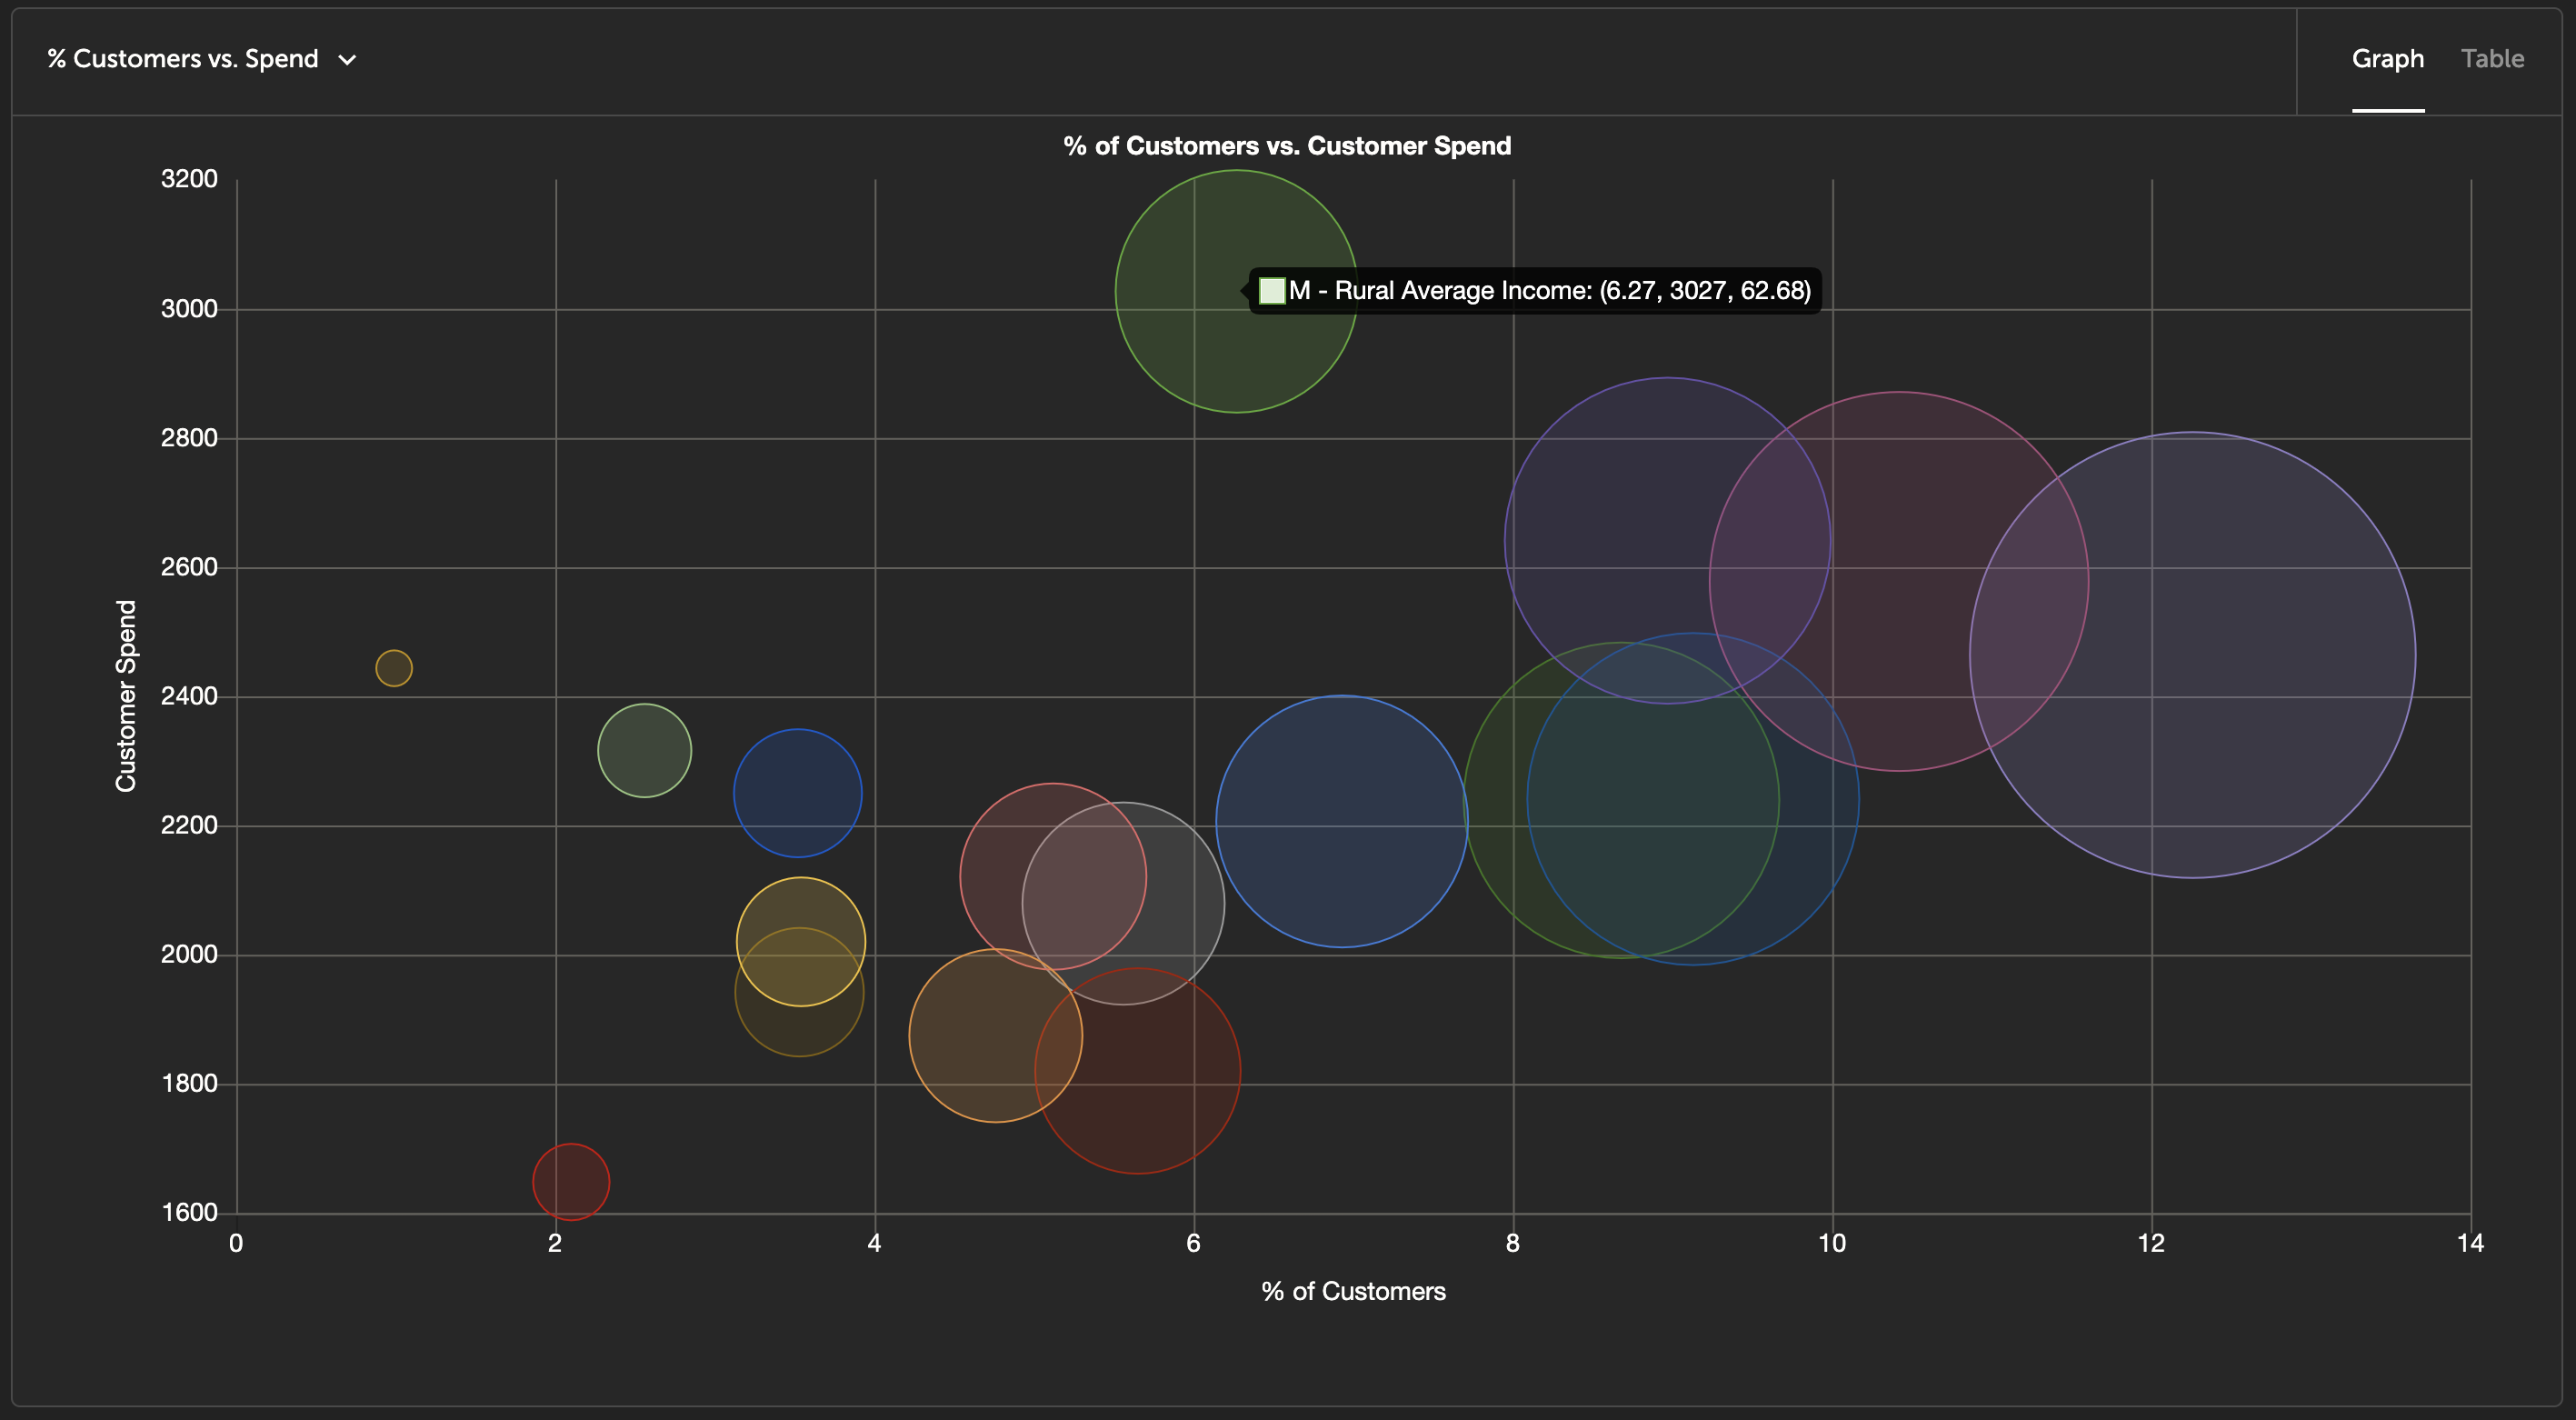
Another example. In the graph below, we've plotted Percentage of Customers vs. Customer Spend. Bubble size represents how large the total population of the given family is (total addressable market).