Metadata
Our proximity also comes with its own suite of metadata. We've taken the time to analyze this data across several different large datasets (such as demographics and sales) in order to make the segments more understandable.
Taxonomy Metadata
Head on over to https://taxonomy.spatial.ai/ for a look at the metadata for the Proximity dataset. If you are a Proximity dataset customer, you can find the full metadata in .json and .csv form in your cloud account.
The taxonomy for the Proximity dataset provides a beautiful interface to explore the segments. You can see, for each segment, how they compare across a range of demographic and other attributes including:
- Social Topics
- Geography
- Age
- Income
- Ethnicity
- Education
- Employment
- Population Density
- Home Ownership
- Voting Preferences
- Tendencies Over Time
- Retail & Restaurant Correlations
We'll provide a little bit more information about some these sections below.
Social Topics
At its core, the proximity dataset is all about social topics. This dataset is based 100% on social media, and for each segment we are providing examples of the most common words/topics that drive high scores in the segment. Let's consider the Coffee Connoisseur segment's topics.
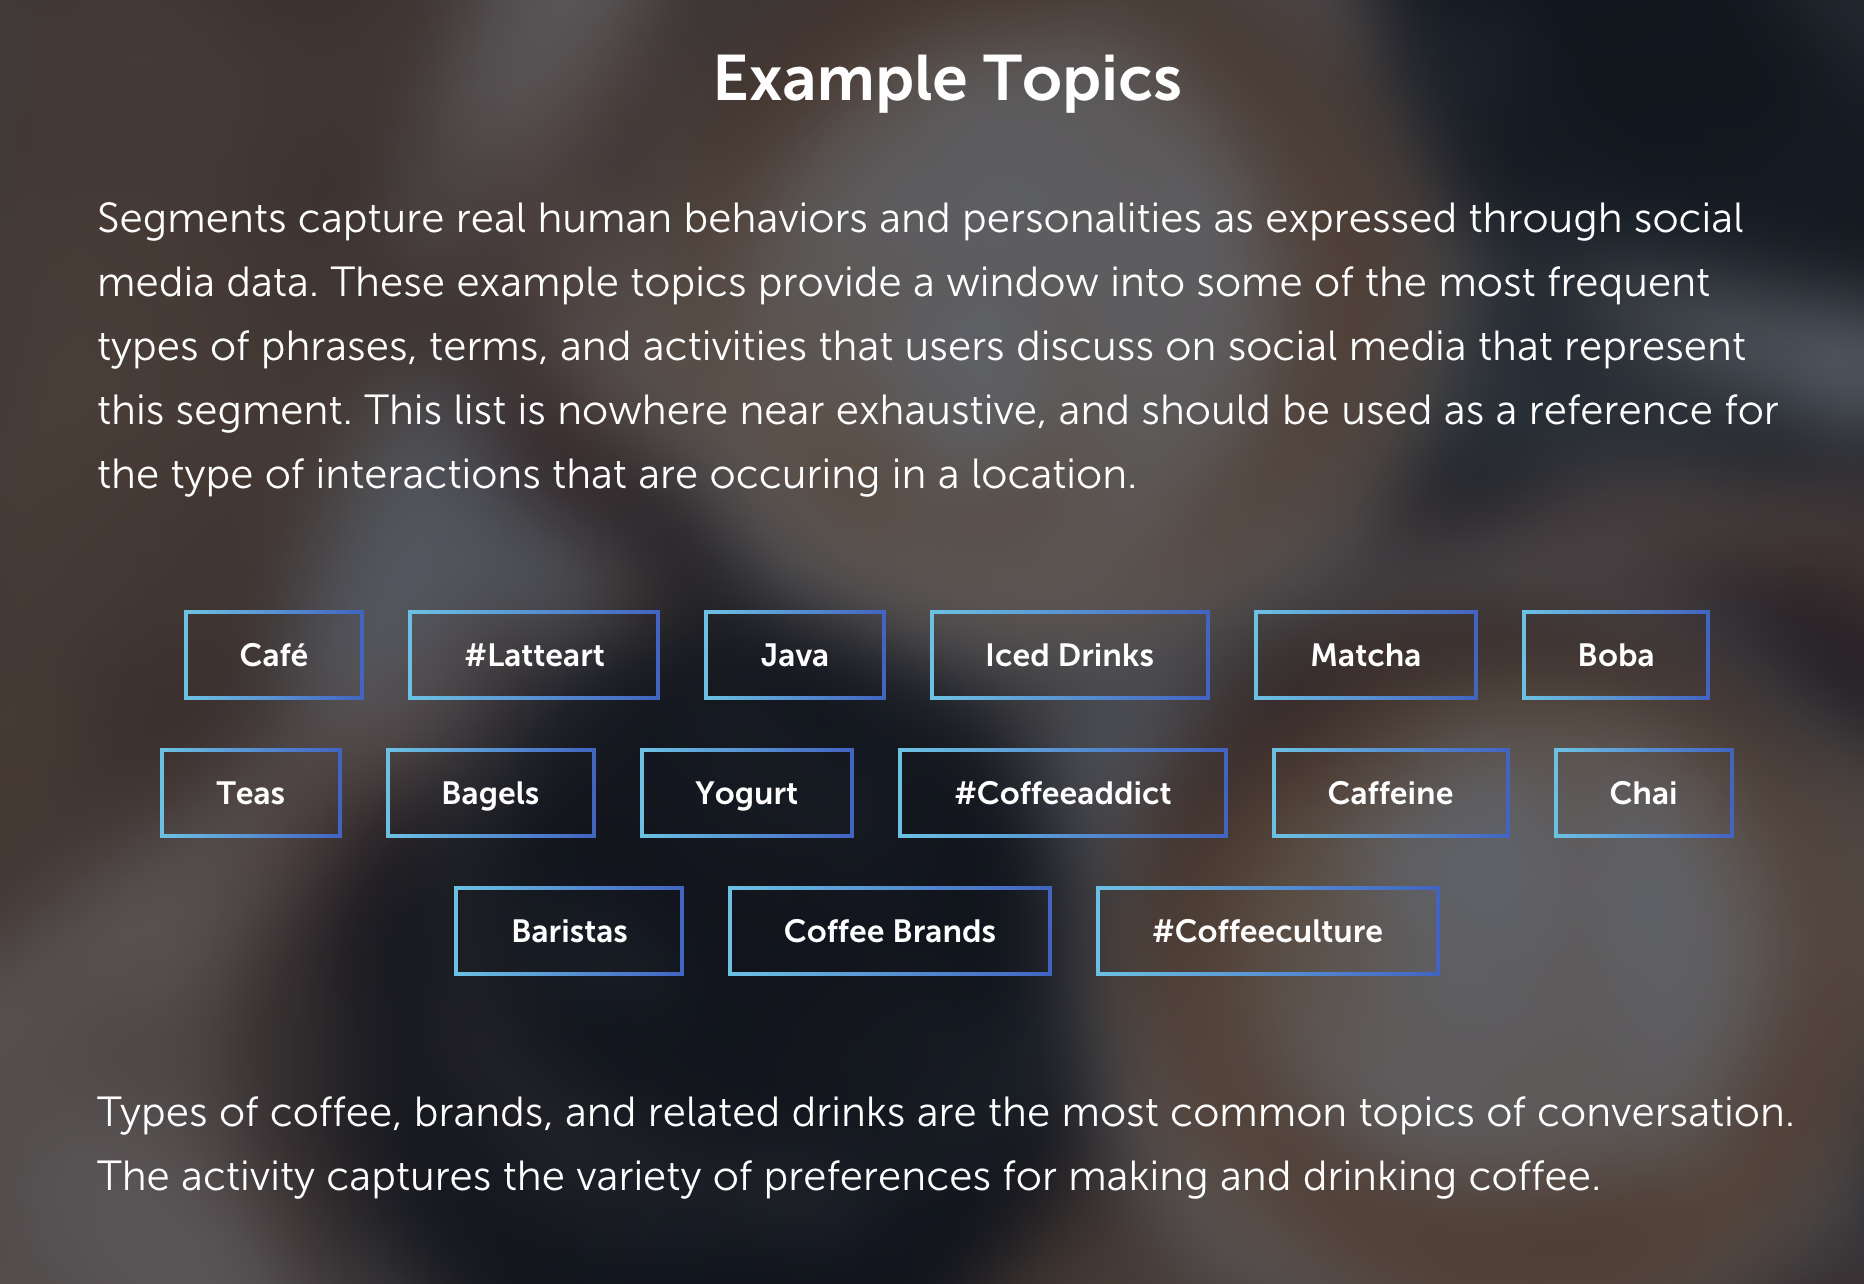
When lots of people are posting words and phrases like those in the screenshot, the Coffee Connoisseur segment will have a high score.
Demographics
There are many demographic variables included in the metadata. In order to calculate these variable values, we selected the top 5% of US Census block groups for each segment and calculated aggregate demographics for those areas.
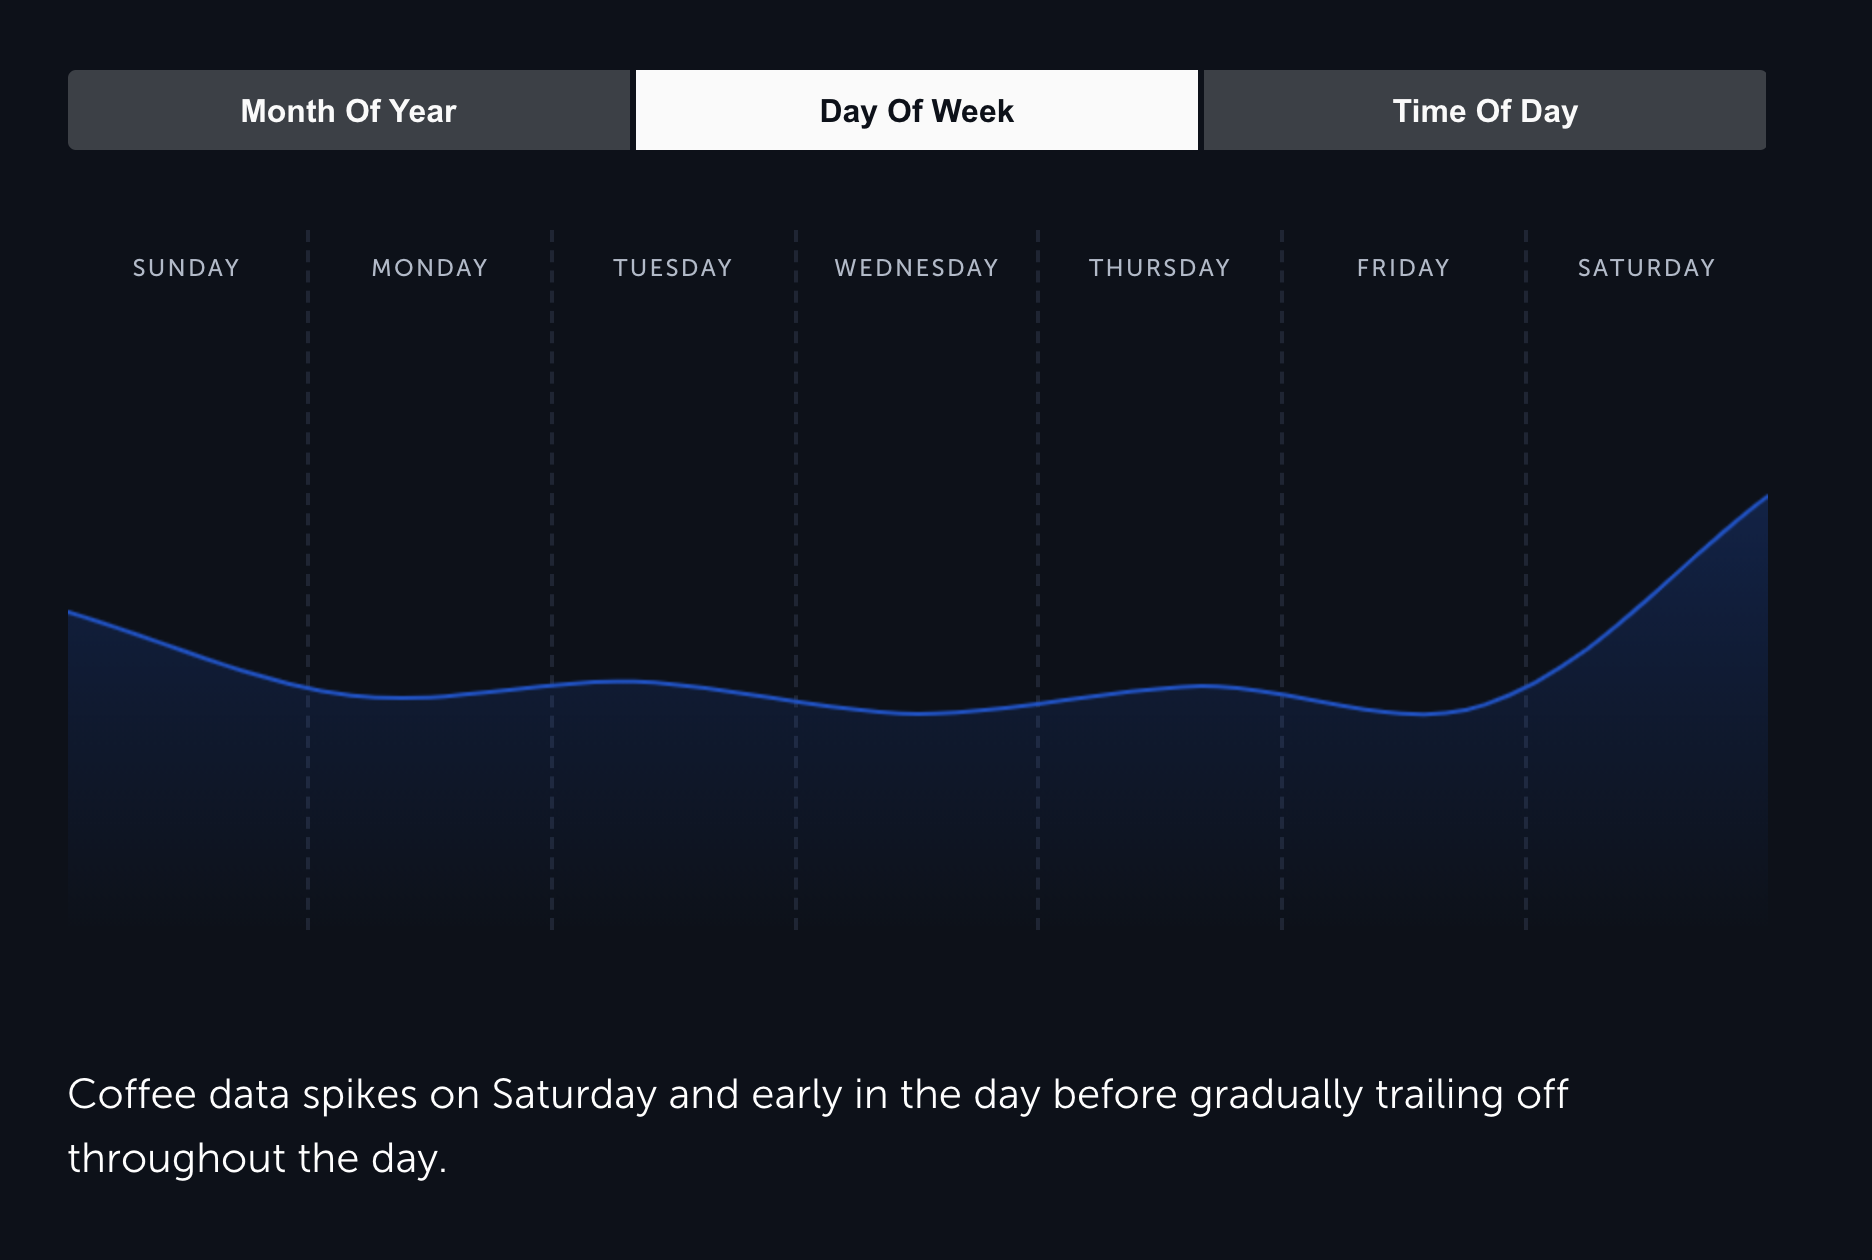
Tendencies Over Time
In order to understand tendencies over time for the segments, we randomly chose social media from each month of the year, day of the week, and time of day. We split that social media into groups and plotted changes in segment scores over those time splits. The results are what you see in the displayed chart.
Retail & Restaurant Correlations
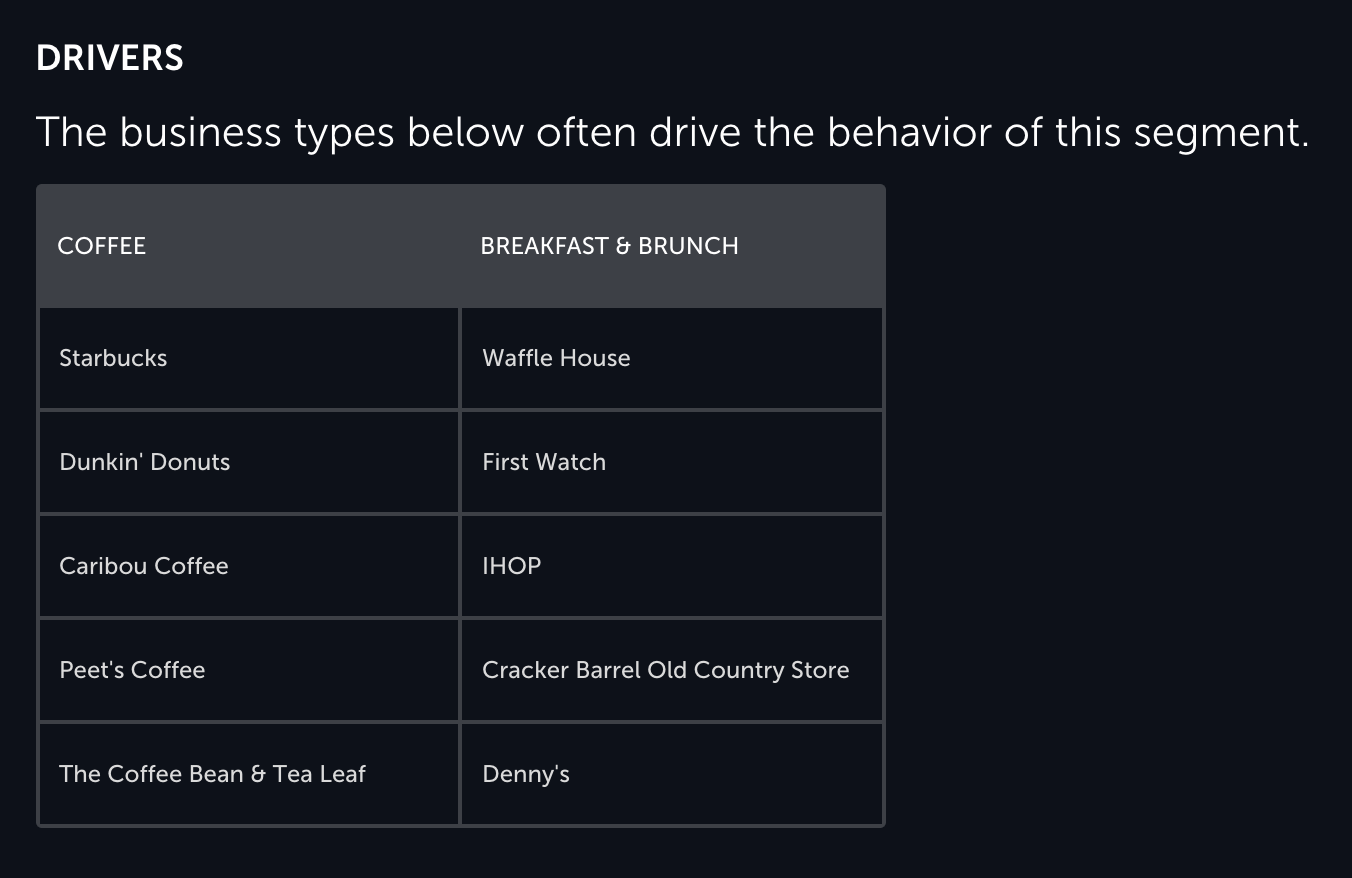
For each segment, we provide the types of businesses that are correlated with this segment. When this segment scores highly, these are the businesses that are most likely to be nearby. These business types have been split into 2 categories-- Drivers and Opportunities.
Drivers are the business types that typically lead to an increase in a certain segments score. For example, coffee shops drive higher scores in the Coffee Connoisseur segment and stadiums drive higher scores in the Organized Sports Segment.
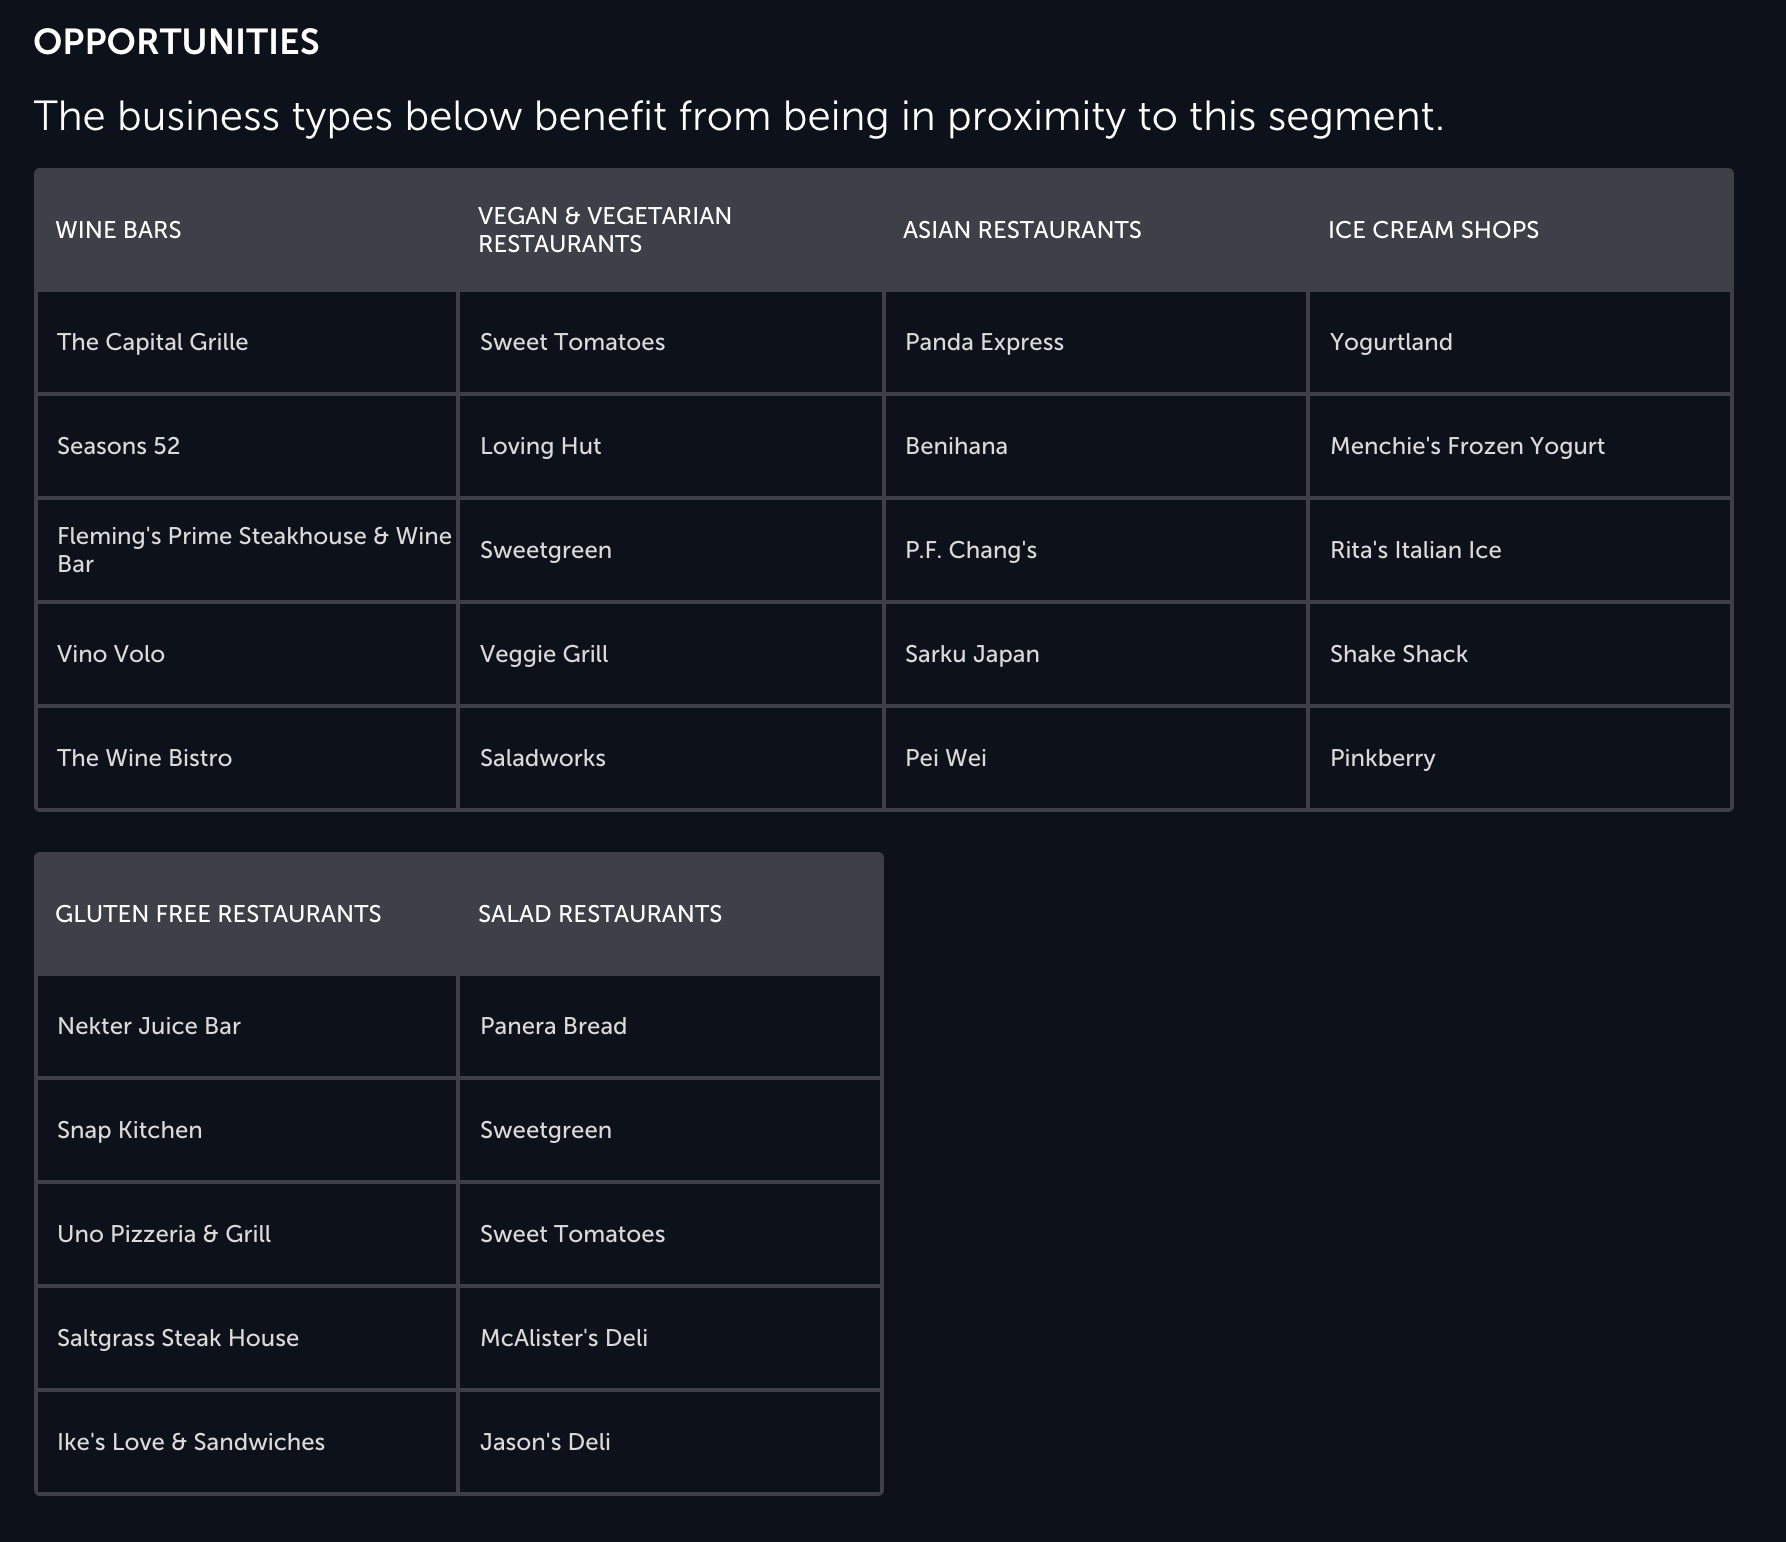
On the other hand, businesses that tend to show up in areas that are high in Coffee Connoisseur behavior but don't lead people to make coffee-related posts are Opportunities. These are the types of businesses that succeed when coffee-related behaviors are present in an area.
Other Dataset Metadata
Using other datasets, we've generated some extremely useful breakouts of these segments. If you are a Proximity dataset customer, you can find the following datasets in your cloud account.
Brand Profiles
By combining mobile visitation data with the Proximity dataset, it is possible to understand brand profiles based on their Proximity data. Here's what this data looks like:
| Segment | United States Postal Service (USPS) | Subway | Dollar General | McDonald's | Shell Oil | Starbucks | ... |
|---|---|---|---|---|---|---|---|
| EA01 - Bookish | 21.3% | 25.2% | 19.9% | 24.5% | 24.1% | 29.0% | ... |
| EA02 - Engine Enthusiasts | 30.7% | 30.4% | 30.3% | 30.5% | 30.4% | 29.1% | ... |
| EA03 - Green Thumb | 27.9% | 28.0% | 25.8% | 27.1% | 28.6% | 31.0% | ... |
| EA04 - Natural Beauty | 35.4% | 29.1% | 33.8% | 28.2% | 30.5% | 27.7% | ... |
| EA05 - Wanderlust | 32.3% | 26.6% | 30.6% | 25.8% | 27.7% | 25.0% | ... |
| ... | ... | ... | ... | ... | ... | ... | ... |
This data is interpreted as the percentage of visitors to a brands' locations that come from areas scoring high for the given segment. For example, the first value in the table is interpreted as 21.3% of visitors to USPS come from areas that score highly for the Bookish segment. The threshold for a "high" score is 80th percentile.
This kind of data can give useful information for marketing or understanding the types areas that a brand should locate in. For example, let's look at Starbucks... here are the top 10 Proximity segments for Starbucks based on mobile visitation.
| Segment | Starbucks |
|---|---|
| EK01 - Organized Sports | 38.2% |
| EE07 - Lighthearted Fun | 35.6% |
| EE02 - Competitive Nature | 35.6% |
| EK02 - Fitness Obsession | 35.0% |
| EK04 - Yoga Advocates | 35.0% |
| EC04 - Connected Motherhood | 34.9% |
| EB07 - Farm Culture | 34.7% |
| EA06 - Handcrafted | 34.2% |
| EA07 - Animal Advocates | 33.9% |
| EI04 - Fitness Fashion | 33.7% |
Starbucks should locate near areas high in Organized Sports, Lighthearted Fun, Competitive Nature, Fitness Obsession, and Connected Motherhood. The combination of these neighborhoods indicate that Starbucks customers come from well off suburban areas. They could even combine these 5 segments and treat them as in index for choosing new locations (like this).
Retail Sales Relationships
We also provide Proximity segments' relationships to various retail sales categories.
| Segment | Art Dealers - naics_45392 | Children's & Infants' Clothing Stores - naics_44813 | Family Clothing Stores - naics_44814 | Men's Clothing Stores - naics_44811 | Clothing & Accessories Stores - naics_448 | ... |
|---|---|---|---|---|---|---|
| Bookish - EA01 | 266.40 | 187.22 | 188.33 | 196.75 | 184.73 | ... |
| Engine Enthusiasts - EA02 | 44.93 | 149.71 | 151.03 | 127.21 | 139.43 | ... |
| Green Thumb - EA03 | 84.94 | 90.04 | 92.76 | 113.81 | 97.71 | ... |
| Natural Beauty - EA04 | 49.25 | 29.45 | 40.59 | 53.76 | 44.53 | ... |
| Wanderlust - EA05 | 157.66 | 99.62 | 121.66 | 134.59 | 122.59 | ... |
| ... | ... | ... | ... | ... | ... | ... |
In this data, an index of 100 indicates that sales are equivalent to the national average and an index greater than 100 indicates higher than average sales.